Fig. 13.
Download original image
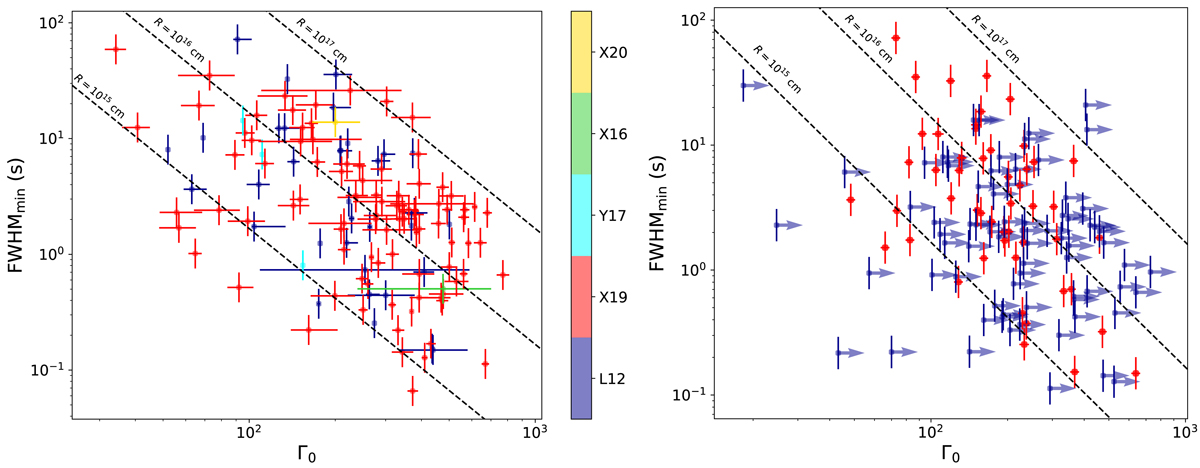
FWHMmin versus the initial Lorentz factor Γ0 for a number of Type-II GRBs. Left: the values for the latter were taken from different data sets, which are colour-coded: L12 (Lü et al. 2012), X19 (Xue et al. 2019), Y17 (Yi et al. 2017), X16 (Xin et al. 2016), and X20 (Xie et al. 2020). Dashed lines correspond to the typical distance ![]() at which the dissipation process responsible for the prompt emission could take place. Right: same as left, except that we calculated Γ0 from the data set by Ghirlanda et al. (2018). Red points are the GRBs belonging to their golden and silver samples, while blue points are lower limits on Γ0.
at which the dissipation process responsible for the prompt emission could take place. Right: same as left, except that we calculated Γ0 from the data set by Ghirlanda et al. (2018). Red points are the GRBs belonging to their golden and silver samples, while blue points are lower limits on Γ0.
Current usage metrics show cumulative count of Article Views (full-text article views including HTML views, PDF and ePub downloads, according to the available data) and Abstracts Views on Vision4Press platform.
Data correspond to usage on the plateform after 2015. The current usage metrics is available 48-96 hours after online publication and is updated daily on week days.
Initial download of the metrics may take a while.