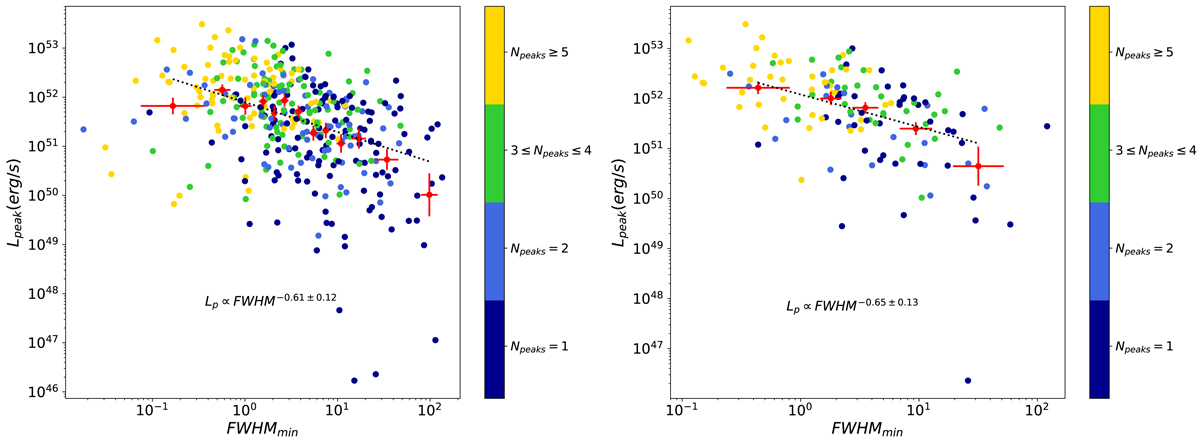
Fig. 11.
Download original image
Peak Luminosity versus FWHMmin for the Swift sample of Type-II GRBs for different number of peaks Npeaks (left panel); Lp versus FWHMmin for the Swift sample of Type-II GRBs, S/N > 12.26 (right panel), for different number of peaks Npeaks. Red dots refer to geometrical mean of groups of GRBs, with each group including 30 GRBs, independently of Npeaks.
Current usage metrics show cumulative count of Article Views (full-text article views including HTML views, PDF and ePub downloads, according to the available data) and Abstracts Views on Vision4Press platform.
Data correspond to usage on the plateform after 2015. The current usage metrics is available 48-96 hours after online publication and is updated daily on week days.
Initial download of the metrics may take a while.