Open Access
Fig. 3.
Download original image
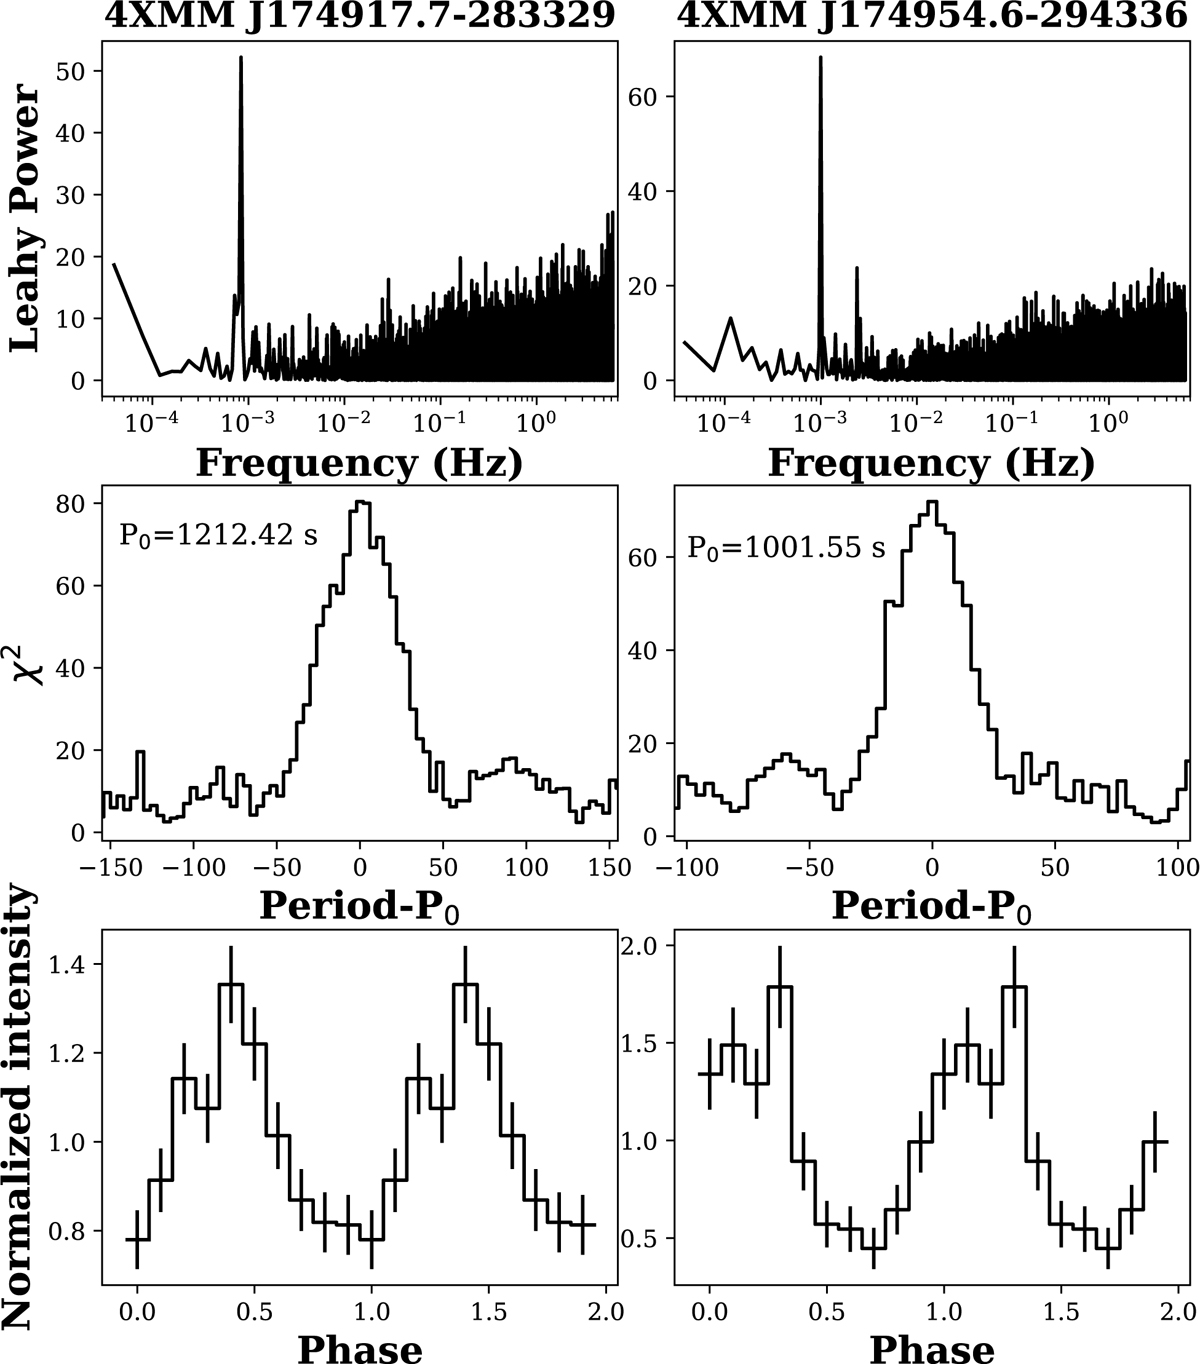
Top panels: periodogram in Leahy normalization obtained from the EPIC-pn light curve of the sources 4XMM J174917.7–283329 (left panel) and 4XMM J174954.6–294336 (right panel). Middle panels: χ2 analysis using the FTOOL efsearch. Bottom panels: folded light curves.
Current usage metrics show cumulative count of Article Views (full-text article views including HTML views, PDF and ePub downloads, according to the available data) and Abstracts Views on Vision4Press platform.
Data correspond to usage on the plateform after 2015. The current usage metrics is available 48-96 hours after online publication and is updated daily on week days.
Initial download of the metrics may take a while.