Fig. 1.
Download original image
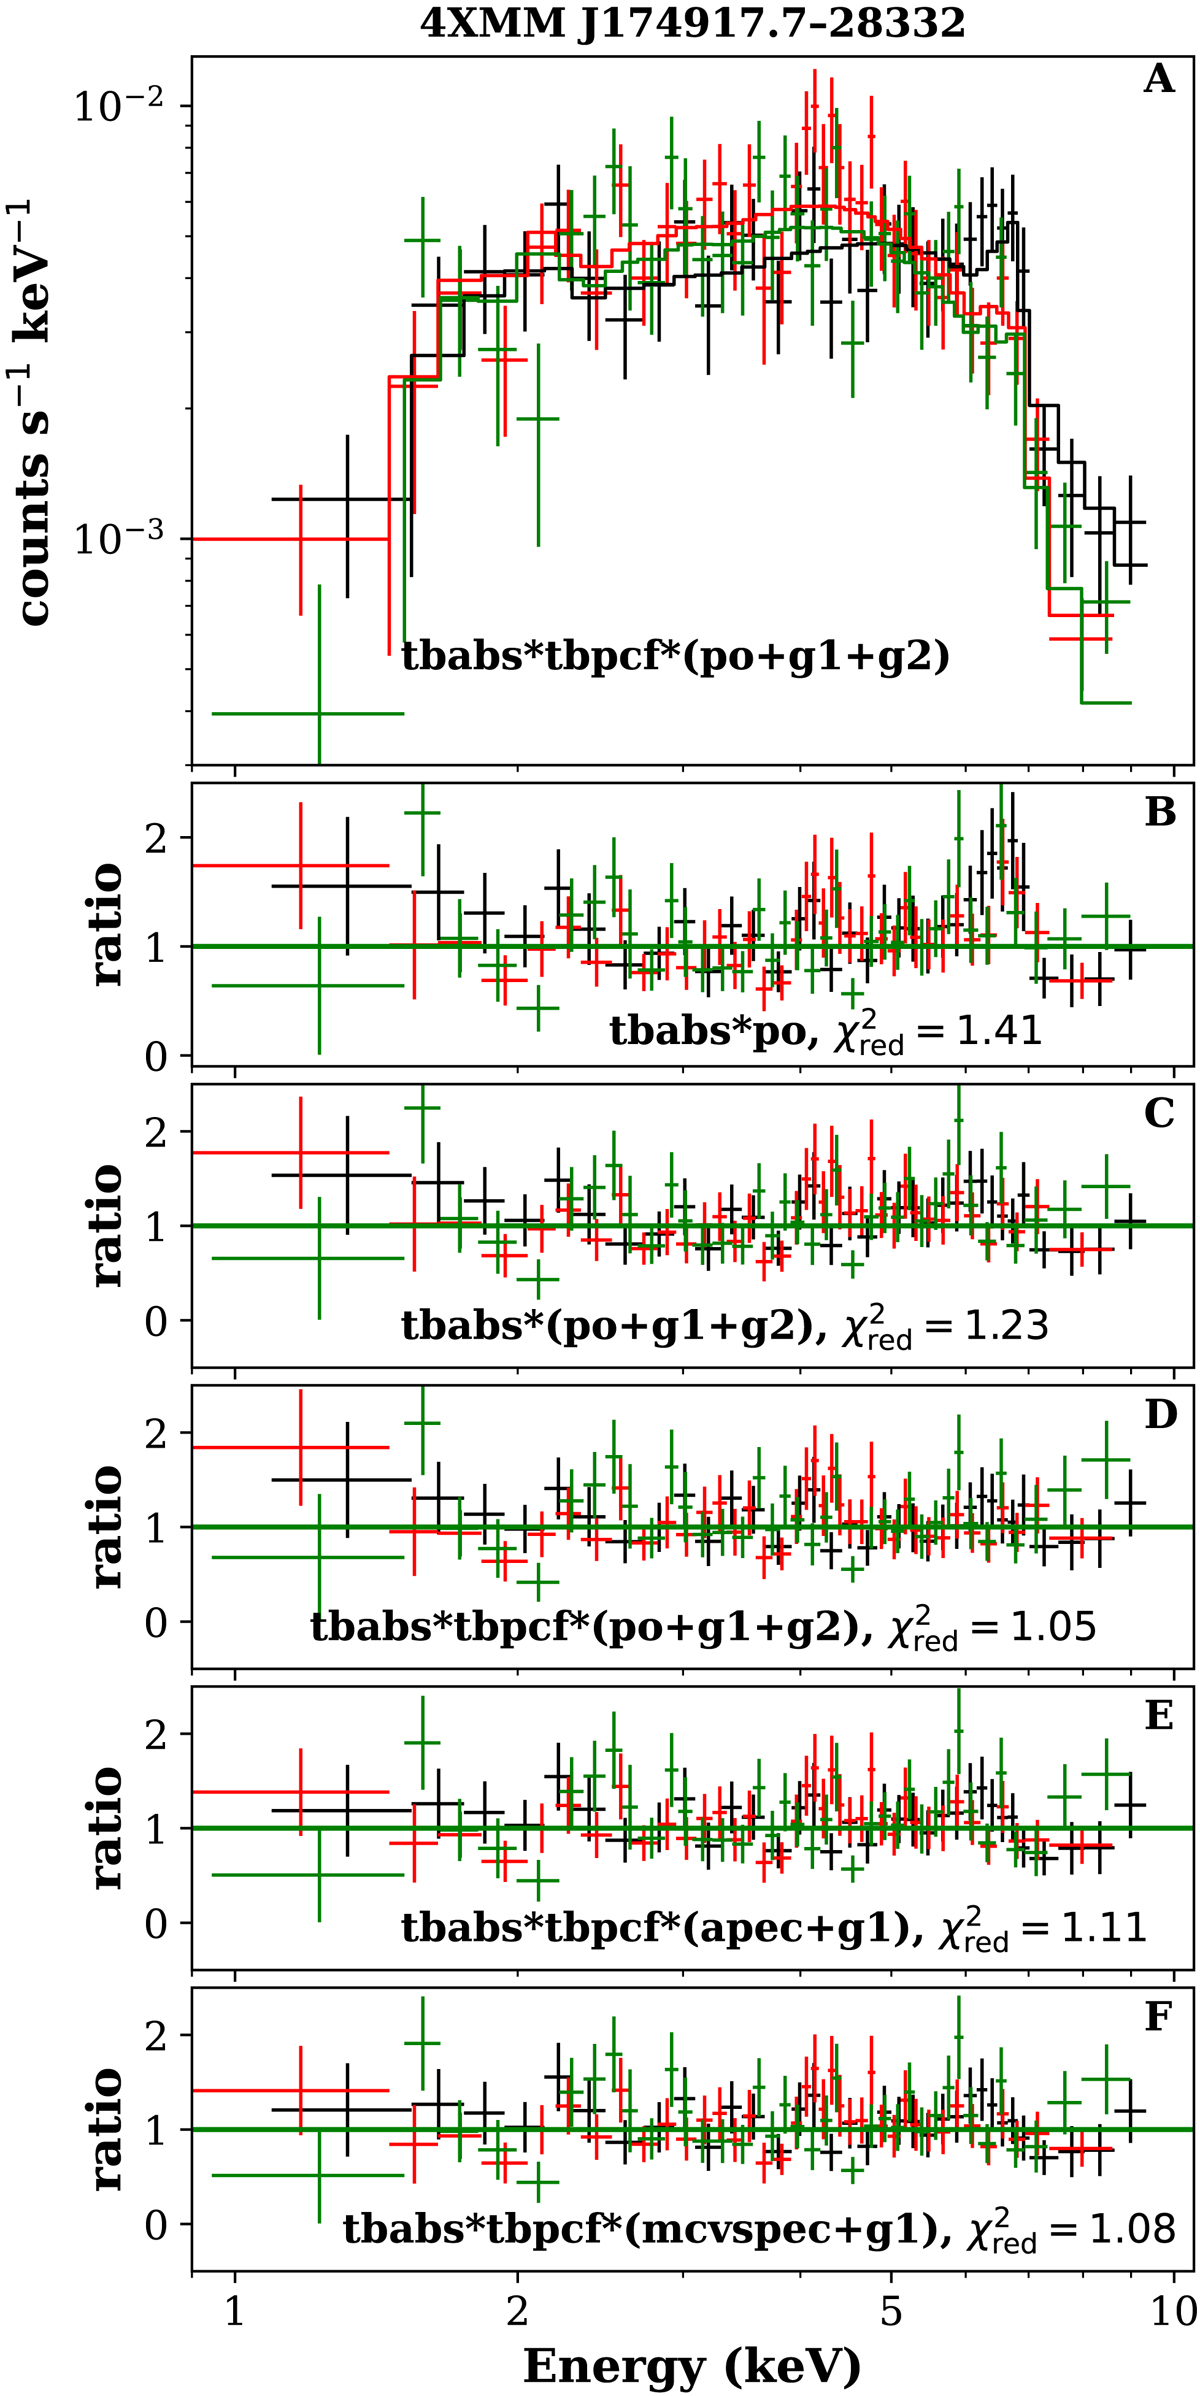
Various spectral model fits to the spectra of 4XMM J174917.7–283329. The black, red, and green represent the spectra from the EPIC-PN, MOS1, and MOS2 detectors, respectively. Panel A represents the best-fit spectral model overlaid on the data points. The lower panels indicate the ratio plot obtained from the fitting of various models. The model components are tbabs (the Galactic absorption), tbpcf (the absorption from a medium partially covering the X-ray source), po (the power-law continuum), apec (emission from collisionally ionized diffuse gas), mcvspec (the continuum emission from the WD accretion column), g1 (the Gaussian line at 6.4 keV), and g2 (the Gaussian line at 6.7 keV).
Current usage metrics show cumulative count of Article Views (full-text article views including HTML views, PDF and ePub downloads, according to the available data) and Abstracts Views on Vision4Press platform.
Data correspond to usage on the plateform after 2015. The current usage metrics is available 48-96 hours after online publication and is updated daily on week days.
Initial download of the metrics may take a while.