| Issue |
A&A
Volume 671, March 2023
|
|
|---|---|---|
| Article Number | L2 | |
| Number of page(s) | 7 | |
| Section | Letters to the Editor | |
| DOI | https://doi.org/10.1051/0004-6361/202245415 | |
| Published online | 28 February 2023 | |
Letter to the Editor
Flybys in debris disk systems with Gaia eDR3⋆
1
Department of Physics “E. Fermi” University of Pisa, Largo Bruno Pontecorvo 3, 56127 Pisa, Italy
e-mail: This email address is being protected from spambots. You need JavaScript enabled to view it.
2
INAF Osservatorio Astrofisico di Arcetri, Largo E. Fermi 5, 50125 Florence, Italy
3
INFN, Section of Pisa, Largo Bruno Pontecorvo 3, 56127 Pisa, Italy
4
Department of Physics, University of Warwick, Gibbet Hill Road, Coventry CV4 7AL, UK
5
Centre for Exoplanets and Habitability, University of Warwick, Gibbet Hill Road, Coventry CV4 7AL, UK
6
Space Research Institute of the Austrian Academy of Sciences, Schmiedlstrasse 6, 8042 Graz, Austria
Received:
9
November
2022
Accepted:
19
January
2023
Abstract
Context. Debris disks represent the last phase of the evolution of protoplanetary disks around young stellar objects where planetary systems had most likely already been formed. Resolved systems show peculiar structures, such as asymmetries or spirals, which may be associated with either the presence of a low-mass companion or dynamical interactions with a perturber during a flyby event.
Aims. We aim to observationally and statistically constrain the influence of flybys in the formation and evolution of debris disks.
Methods. We compiled a sample of 254 debris disks with ages between 2 Myr and 8 Gyr that are either part of an association or isolated, drawing the binary and planetary companions of the systems mainly from the literature. Using the Gaia eDR3 astrometric data and radial velocities of our sample, as well as all the sources in a specific region of the sky, we reconstructed the relative linear motions in the last 5 Myr and made predictions for the next 2 Myr. Relating the Hill radius of each debris disk system and the closest distances reached by the two sources, we defined the flyby events in terms of position and time.
Results. We find that in the period between the last 5 Myrs and the next 2 Myrs, 90% of the analyzed systems have experienced at least a close flyby, while 7% of them have experienced flybys at distances greater than 0.5RHill. In particular, 75% of them have experienced at least one past close encounter and 36% multiple past close encounters. From the sub-sample of resolved debris disk (41 out of 94), 80% of the analyzed systems experience at least an encounter within 0.8 pc. From the subsample of 10 debris disks with planets, half of these systems do show misalignments between disk and planet, stirring, or asymmetries. Systems with a misalignment between the planetary orbit and the disk do indeed experience at least one flyby event. In particular, when the planet orbits have a difference with the disk inclination higher than about 20°, as in the case of HD 38529, we find that multiple close encounters have taken place in the last 5 Myr, as theoretically predicted.
Conclusions. The high incidence of encounters, particularly close encounters, experienced by the systems in the last 5 Myr suggests the fundamental impact of flybys on the evolution of debris disks. Moreover, despite the low statistics, it is interesting to highlight that flybys that have been theoretically predicted so far in peculiar resolved systems have also been observationally constrained.
Key words: protoplanetary disks / astrometry
Full Tables 1 and A.1 are only available at the CDS via anonymous ftp to cdsarc.cds.unistra.fr (130.79.128.5) or via https://cdsarc.cds.unistra.fr/viz-bin/cat/J/A+A/671/L2
© The Authors 2023
 Open Access article, published by EDP Sciences, under the terms of the Creative Commons Attribution License (https://creativecommons.org/licenses/by/4.0), which permits unrestricted use, distribution, and reproduction in any medium, provided the original work is properly cited.
This article is published in open access under the Subscribe to Open model. This email address is being protected from spambots. You need JavaScript enabled to view it. to support open access publication.
1. Introduction
Detected at all ages around very young 1 Myr old stars and up to 10 Gyr, debris disks are usually associated with the last stage of the evolution of protoplanetary disks, where only a remnant of dust remains. This dust is possibly made up of the second generation of material whereby the gas must have already dissipated and a planetary system had already formed. The far- and near-infrared (FIR and NIR) excess emission of debris disk systems originates from a cold disk, namely, an analog of the Kuiper belt in the Solar System, and/or a hot disk, namely, an analog of the zodiacal dust (e.g., Hughes et al. 2018). This general picture has been changing over the last decade, since the gas has also started to be commonly detected in debris disks after the first detection of CO observed for HD 9672 (Dent et al. 2005).
A variety of structures have been resolved not only in protoplanetary disks, but also in debris disks (Hughes et al. 2018, and references therein). In particular, clumps and asymmetries can be caused either by the presence of companions (Wyatt et al. 2007) or, for instance, by flybys (Kalas 1996). During a flyby around a protoplanetary disk system, predictions state that there is a possibility that a part of the disk material is captured by the perturber object, leading to the formation of a secondary disk around it (e.g., Cuello et al. 2019, 2020). According to hydrodynamical simulations, the disk behaves differently in terms of the size of the particles and the pitch angle, depending on whether the encounter is prograde or retrograde (Cuello et al. 2019). Specifically, prograde encounters lead more frequently to the formation of spirals, while retrograde encounters are expected to be associated with warps. Also, the concentration of dust in the spiral arms could be linked to an enhancement in planetary formation; in the case of the high frequency of close flybys, planetary systems could be then more common. The flyby distance and the mass ratio influence the amount of material that is exchanged between the main star and the perturber.
In this letter, we aim to observationally constrain how flybys can be responsible for the formation and evolution of debris disk systems. The high precision of Gaia eDR3 astrometry and radial velocity of debris disks, presented in Sect. 2, have been used to reconstruct the trajectories of about 70% of the source of the catalog with reliable data, together with the trajectory of sources in a certain sky area around the debris disks. In Sect. 3, we describe our analysis and results. We summarize our findings in Sect. 4.
2. Gaia eDR3 observations of debris disks
We compiled a sample of 254 debris disks from surveys available in the literature at different wavelengths, from the infrared to the millimeter with Spitzer (Meshkat et al. 2017; Chen et al. 2014), Herschel (Booth et al. 2013; Vican et al. 2016; Morales et al. 2016), and ALMA (van der Plas et al. 2019; Marino et al. 2020). All of them show a Gaia (Gaia Collaboration 2016) eDR3 counterpart, while about half of the original sample (118 sources) have reliable astrometry and radial velocity in the Gaia eDR3 catalog (e.g., Gaia Collaboration 2021).
Since the stellar photocenter can generally be altered by the presence of a peculiar activity on the star’s surface or close to it, we first investigated the effect of the debris material around the central object in Gaia astrometric measurements. The spectral energy distribution (SED) of debris disks is characterized by the stellar photosphere and mid- to far-infrared (MIR-FIR) excess due to the debris material around the central star, even though the peak of the Gaia band between 330–1050 nm covers mostly the photosphere of A to M type stars. This implies that only the contribution from the inner material can affect the SED in Gaia’s range. In the first approximation, we computed the ratio between the flux density of stars and disks1 in the Gaia wavelength ranges. Using a simulation of debris disk systems (DMS; Kim et al. 2018), we varied the spectral type of the central star and the disk properties (e.g., inner and outer radius of disks consistent with those of the systems in our sample) as well as the dust parameters (e.g., blow-out grain size, slope of the grain size distribution, and dust composition).
We find that this ratio lies between 10−3 to 10−5, which means that the contribution from debris disks on the SED in the Gaia bands is negligible. Consequently, we conclude that the motion of the star photocenter cannot be altered by the debris material. We note that this ratio could increase only in the case of a disk more massive with at least two orders of magnitudes than the typical disk mass (e.g., 10−9 to several 10−7 M⊙; Greaves et al. 2005, and references therein) or with a high abundance of small grains with a higher slope of the grain size distribution than that expected from a standard equilibrium collisional cascade (i.e., −3.5; Dohnanyi 1969).
3. Analysis: Flybys
The Gaia catalog allows us to reconstruct the flyby events (e.g., Ma et al. 2022; Bailer-Jones 2018), taking into account a large sample of potential perturbers. In particular, we derived the linear galactocentric coordinates and velocities2 from the position, parallax, proper motions, and radial velocity from Gaia. A flyby takes place when the minimum distance between the two sources becomes smaller than the Hill radius, RH, i, which is defined as the gravitational sphere of influence of the i star.
The distance between possible flyby objects and the main star is computed every 45 000 years. This means that assuming a realistic relative proper motion around 10 km s−1, there would be a new calculation for every 0.35 pc of change in distance between the stars. This is less than the measurement of any calculated Hill radius and also appears to be a good sampling rate for completeness.
Areas of the sky are defined for all 118 stars bearing debris disks and having a DR2 radial velocity measure. Those belonging to an association are grouped together, while those that do not belong to any association are distinguished into five groups. We adopted the quantitative definition of the Hill radius from Ma et al. (2022):
 (1)
(1)
where mmain is the mass of the star, Menc(R) is the part of the mass of the galaxy which is enclosed within the stellar orbit, and R is the distance of the star from the galactic center defined as
 (2)
(2)
where X, Y, and Z are the linear galactocentric coordinates of the star derived from the Gaia eDR3 catalog. For most of the sources, we consider the mass of the central star compiled in the TESS catalog (Stassun et al. 2019). Menc(R) is calculated assuming a spherical distribution of the mass of the Milky Way, which leads to the following formula:
 (3)
(3)
where R is the distance of the star from the galactic center, G is the gravitational constant, and V(R) is the circular velocity, which can be approximated as the following linear function:
 (4)
(4)
where R⊙ is the distance of the Sun from the galactic center (as in, e.g., Eilers et al. 2019).
The mass and computed Hill radius are given in Table 1. Since possible flybys between 5 Myr in the past and 2 Myr in the future are being considered, the distance of the star from the galactic center changes over this time. This provides an uncertainty on the determination of the Hill radius, which is the only origin assumed for the error given in Table 1.
Masses (from Stassun et al. 2019) of the main objects are given in the first column, while the computed Hill Radii and errors in the second and third columns.
The position of the encounter is computed by subtracting the galactocentric position defined by Xi, Yi, and Zi of each one of the i objects belonging to the area of the sky, from the position of the main star defined by Xmain, Ymain, Zmain. The new position for the perturber and each debris object are computed, respectively, as: Xi + VX, i t, Yi + VY, i t, Zi + VZ, i t, and Xmain + VX, main t, Ymain + VY, main t, Zmain + VZ, main t, where V is the velocity and t is the time step of each iteration of 700 years.
From the Hill radius of the main object (given in Eq. (1)), the position and time of the flyby are thus defined as XF, i, YF, i, ZF, i, and tF, i. The errors in position and time of the encounter are computed from a Monte Carlo simulation, extracting 50 random values of parallax, position, proper motion, and radial velocity within a Gaussian distribution centered at the values and errors from Gaia of parallax, position in the sky, proper motion, and radial velocity (corresponding to the galactocentric position Xi, Yi, Zi and to VX, i, VY, i, VZ, i). For each of the 50 cases, we calculated the closest distance reached by the perturber during the flyby and the time of the flyby. The lower and upper errors are given by the difference, respectively, between the minimum and the maximum value found with this method and values of XF, i, YF, i, ZF, i, tF, i. About 80% of the perturbers have an error lower than 1 pc for the flyby distance and 99% of the perturbers lower than 1 Myr for the flyby time.
We highlight that the presented methodology considers the multiple flybys as single events that had not been perturbed by any previous encounter. The reconstruction of the trajectory of the main star is reliable after the most recent flyby – and even earlier than that when the last perturber has a mass of Mperturber ≪ Mmain. This first approach presented in this letter is thus fundamental in understanding that if at least a close flyby took place during the evolution of a system and its debris disk. Under the assumption of a negligible acceleration, this method defines an upper limit on the time of the flyby, since the effect of acceleration would be only to speed up the star motion, without changing the direction. This method is capable of identifying multiple flybys as single events since it is not reconstructing the deviation of the motion direction that takes place during a flyby. Potential perturbers are searched for in a different area of the sky: either in a region of the association where a debris disk belongs to it or, for isolated sources, in different regions of the sky that include the main source; specifically, four regions of 90° ×90° for sources with parallaxes larger than 7.4 mas, and a fifth region of 80° ×50° for sources between 3 and 10 mas in parallax (more specific limits in latitude, longitude, and parallax are given in Appendix A). A close encounter is defined as an encounter where the minimum distance is dmin < 0.5RHill (e.g., Ma et al. 2022).
To validate our methodology, we used the observations of HD 106906 presented by De Rosa & Kalas (2019) and Ma et al. (2022). Since only the radial velocity of HD 106444 is in Gaia DR2 (and consequently in Gaia eDR3), we take the radial velocity from Song et al. (2012) and Gontcharov (2006), respectively, for HIP 59721 and HD 106906. We also confirm the two expected flybys for these stars, corresponding to HD 106444 (flyby at 0.19 pc 2.96 Myr back in time, in agreement with the expected flyby at  pc and
  Myr back in time), and to HIP 59721 (flyby at 0.66 pc and 1.55 Myr back in time, while Ma et al. (2022) found a minimum distance of 0.71 + 0.18 pc at 2.19–1.03 Myr back in time).
4. Results
From the linear velocities in 3D of the main objects and perturbers, the relative velocities were found to be in the range of 10–100 km s−1. Taking into account all the flybys within 5 Myr and in the next 2 Myr, 90% of the analyzed systems have at least a close flyby (as defined in Sect. 3), while 7% are flybys at distances higher than 0.5RHill. In particular, if we concentrate on close encounters, we find that 75% of the debris disk systems experienced at least one close flyby, while 62% are expected in the near future; moreover, 45% of the systems experienced both past and near-future close encounters. The histograms in Fig. A.1 show that past flybys are taking place at any age between ∼1 Myr and ∼5 Gyr and around stars with all spectral types between F0 and M1. Moreover, 39% has one close encounter in the past, as seen from Fig. A.1, while 36% has multiple past close encounters.
For the 94 systems with resolved debris disks, we can proceed with a more detailed analysis. Figure 1 shows the size of the disks, positions of planets, and low (M < 0.4 M⊙) and high-mass companions compiled from the literature. The distances of the flybys of the systems with radial velocities (41 out of 94) which happened in the last 5 Myr are also shown. We find that 80% of the analyzed systems experienced at least an encounter.
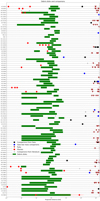 |
Fig. 1. Sizes of the resolved debris disk systems and the positions of planets, companions, and flybys from the central object. On the x-axis, the projected distance from the main star is given in AU. In the y-axis, all systems with resolved debris disks are listed. The panel overlaid in the figure explains the different symbols and colors. |
Compiling the spectral energy distributions (SEDs) of the 162 perturbers of all the systems that caused close encounters within the last 5 Myr, we find that 25% of all of them do show a FIR excess over the stellar photosphere. Since the orbital change of planetesimal (e.g., eccentricity and inclination) can result from the existence of nearby sculpting planet through close encounters (Larwood & Kalas 2001; Kalas et al. 2007; Dong et al. 2020), possibly leading to the change of disk’s vertical scale height (Quillen et al. 2007); this could be a signature of debris material around the central star.
Moreover, we consider the ten debris disk systems with known planets: HD 38529, HD 38858, HD 50571, e Eri, *q01 Eri, HD 82943, HD 69830, HD 128311, HD 206893, and AU Mic. Half of these systems do show misalignments between disk and planet (Xuan et al. 2020), stirring (Moór et al. 2015), or asymmetries (Lovell et al. 2021; Marino et al. 2020) in the disks. These have been theoretically interpreted by self-stirring, past flybys (Moór et al. 2015; Cuello et al. 2019), or companions. We can now observationally check the frequency of past flybys in these systems.
Single debris disks hosting planets. In the system of HD 38529 there is a difference in inclination between the disk and planetary system of at least Δi = 21–45° (Xuan et al. 2020). We note that we found several possible flybys for this star, with the closest one being caused by Gaia eDR3 6530376419268321280, reaching a minimum distance of  pc
pc  Myr back in time. This means that there is a chance that the object could have interacted with the disk and the planets. This object has an absolute magnitude of G = 8.788 ± 0.003 mag. Other possible past flybys we found are the ones caused by Gaia eDR3 3241155739457638272 0.54 ± 0.01 Myr back in time at a distance of
  pc, by PMJ05428+1613E 0.18 ± 0.01 Myr back in time at a distance
  pc, and by HD 246651 0.37 ± 0.01 Myr back in time at a distance of
  pc. The companion, HD 38529B, which lies at d = 12 018 ± 21 AU in projected separation and could be older than the main star according to our isochrones, does not have a Gaia DR2 radial velocity measurement. According to the analysis from Xuan et al. (2020), interactions between the planets, disk, and companion could explain the misalignment, either through disk warping or through a misalignment between the planes of the companion and of the outer planet, ultimately leading to the misalignment of the disk.
Instead, HD 82943 shows coplanarity between the planets and the disk. In fact, the inclination of the orbit of the planets Iplanets = 20 ± 4 deg is in line with the inclination of the disk Idisk = 27 ± 4 deg (Kennedy et al. 2013). We find possible close flybys caused by CD-26 8683 0.29 ± 0.01 Myr back in time at a distance of  pc and by BD-02 2645 0.24 ± 0.01 Myr back in time at a distance of
  pc. Then we have HD 128311 which hosts two giant planets, with masses around 1–3MJ, with the orbits in a 2:1 resonance (Moro-Martín et al. 2010). The inner radius of the disk is external to the orbit of the planets. We find a possible flyby caused by Wolf 295 A at a distance
  pc
pc  Myr back in time. HD 50571 hosts a disk resolved by Herschel at 70, 100, and 160 μm. The nature of this disk has been explained by Moór et al. (2015) by self-stirring of planetesimals in the early stages of the protoplanetary disks: the larger ones influence the trajectories of the smaller objects leading to a collisional cascade. Since the growth time of the planetesimals is proportional to
  , with P being the period and S the surface density of the disk, the cascade begins in the inner disk and propagates outwards (Moór et al. 2015). Companions and stellar flybys could be the reason for additional stirring linked to other collisional cascades, but we did not find any companion. The planet, undetected by Gaia, is a 30 ± 15MJ brown dwarf orbiting at d = 20.3 ± 0.3 AU (Konopacky et al. 2016). The closest flyby happens at a distance
  pc 0.68 ± 0.01 Myr back in time with the transit of iot Hyi, with another close flyby being caused by TYC 8854-1126-1 further away back in time (
 Myr ago at a distance of
  pc). CD-60 6470A is another possible source for a flyby, with an encounter
  Myr back in time at a distance
  pc. We also find that e Eri hosts a very faint disk (Kennedy et al. 2015) and at least three (possibly six) inner super-Earths (Feng et al. 2017). We do not find any close encounters in the past 5 million years for this object, nor do we find any companions either.
HD 206893 had possible close encounters with HD 190617 ( pc 0.31 ± 0.01 Myr back in time), HD 189242 (
 pc 1.24 ± 0.01 Myr back in time) and HD 182261 (
 pc
pc  Myr back in time) from our analysis. The system has a brown dwarf at 11 AU and another one at 2 AU; the orbit of the outer one is likely eccentric, with
  (Marino et al. 2020). The disk has a gap at 74 AU, which could be explained by the presence of a Jupiter-like planet, and asymmetries with a brighter NE arm which could be explained by the companion (Marino et al. 2020). The impact of possible flybys hasn’t been studied in the literature. HD 69830 experienced an encounter with HD 57901 at
  pc at 0.31 ± 0.01 Myr back in time. The system has known planets and an asteroid belt within 3 AU from the star. We find that *q01 Eri shows a flyby with HD 23356 at
  pc, 0.31 ± 0.01 Myr back in time and another one with HD 39855 0.61 ± 0.01 Myr ago at a radius
  pc. A 0.2–0.4 Ms companion, WT 50, is found at 37350 ± 29 AU in projected separation. Asymmetries in the disk could be modeled by an eccentric disk, the presence of a clump on the inner SW edge, or a combination of both. The clump shows the most consistency with the data and could have originated from a disk-planet interaction or from a collision (Lovell et al. 2021). Since the asymmetry is in the inner part of the disk, a planet-companion seems a much more likely explanation than a flyby.
We note that AU Mic was not shown to experience any close past or future encounters, but only multiple flybys at distances greater than 0.5RHill. More precisely, in the last 5 Myr, the most recent flyby was caused by Gaia EDR3 6427708902553822592 0.17 ± 0.01 Myr ago at a radius of  pc, along with two other flybys by HD 283750
  Myr ago at a radius of
  pc and Gaia EDR3 436648129323934592 0.28 ± 0.01 Myr ago at a radius of
  pc, respectively. This system is a young M star (20–30 Myr old) and clumps have been observed in it, as well as a Neptunian planet detected with TESS (Plavchan et al. 2020). A second planet, AU Mic c, with an orbital period of 18.86 days has been recently discovered (Gilbert et al. 2022; Martioli et al. 2021) and confirmed (Wittrock et al. 2022). A new planet, AU Mic d, has been discovered and it is now undergoing validation (Wittrock et al. 2023).
5. Discussion and conclusions
The main result of our study concerns the extremely high fraction of flyby events experienced by debris disks: in the last 5 Myr and in the next 2 Myr, we find that 90% of the analyzed systems have experienced at least one close flyby, while 7% flybys have taken place at distances higher than 0.5RHill. Moreover, 80% of the subsample of resolved debris disks experienced at least a close flyby event (i.e., within 0.8 pc) in the last 5 Myr. This especially high frequency is not preferentially found at an age or spectral type. It is important to highlight that in our approach, we consider possible perturbers of the main debris disk to be all spatially selected sources – and not only cluster members, as done, for instance, by Ma et al. (2022). We note that this approach might be valid in the first approximation for an isolated cluster. This situation has been also simulated to constrain the effect of flybys in the cluster dynamics and protoplanetary disk evolution. In particular, in the case of low-mass clusters Pfalzner & Govind (2021) found a higher frequency of close flybys compared to previous studies. On the one hand, it will be now important to reconstruct in 3D the dynamical history via 3D flybys in the young systems at different ages and different evolutionary phases of the disks in order to understand whether this is a fundamental effect that needs to be taken into account. On the other hand, when concentrating only on clusters, it will be fundamental to also reconstruct the dynamical history of sources without disks today to explore the impact of destructive flyby events in young clusters.
Moreover, from the spectral energy distribution of all the 162 perturbers, we find that 25% of them that have experienced a close encounter within the last 5 Myr show a FIR excess over the stellar photosphere. This might be the first signature of debris material around the perturbers which may originate from the exchange of dust between the main star with its debris disk and the perturber. This dust exchange has been theoretically predicted by 3D simulations, which suggest a lower dispersion of dust for the primary disk when the perturber already has a secondary disk (Picogna & Marzari 2014). The full 3D geometry is fundamental to understand mass loss. From these simulations, it can be seen that in the case of two similar disks, up to 15% of the mass of the disk can be exchanged, with a dependence on the angle of incidence (Picogna & Marzari 2014). Studying debris disks in binary systems, Thebault et al. (2021) also found that a dust exchange from the primary to the secondary disk is responsible for a circumsecondary ring.
The subsample of ten debris disks with known planets and resolved disks forms a basis for the discussion of the influence of binarity, planet formation, and flybys in the evolution of debris disks. The misalignments between the planes can be caused by interactions with stellar companions or other planets, which could excite eccentricities and inclinations for the orbits of the planets and of the disk. As discussed in Picogna & Marzari (2014), misalignments are considered to be a particular signature of a past flyby, with a maximum value of tilting of 9° between the orbits of the planet and the disk. Exceptionally, they could be even larger in the case of multiple past flybys. A primordial origin of such misalignments has been discussed (e.g., Kennedy et al. 2013). Such a misalignment between the plane of the planets and the disk can also be the only remaining signature of the flyby for the orbit of the planets. Simulations also show that the encounter could temporarily cancel gaps created by the planets or by companions, as other preexisting structures (Picogna & Marzari 2014).
Warping and puffiness in the disk shape could be caused by an inclined companion on a very small timescale, namely, lower than 5 Myr. For example, in the case of HD106906, Moore et al. (2023) found a recent close encounter with a free-floating planet to be responsible for a companion with orbital parameters. This is in agreement with observations of HD106906b, as we found in our observational constraints.
∫ Fdisk dλ/∫ Fstar dλ.
Using the Python coordinate conversion galactocentric.
Acknowledgments
This work has made use of data from the European Space Agency (ESA) mission Gaia (https://www.cosmos.esa.int/gaia), processed by the Gaia Data Processing and Analysis Consortium (DPAC, https://www.cosmos.esa.int/web/gaia/dpac/consortium). Funding for the DPAC has been provided by national institutions, in particular, the institutions participating in the Gaia Multilateral Agreement. The authors thank our referee Giovanni Picogna for the comments and suggestions that helped to improve this letter. MK gratefully acknowledges the funding from the Royal Society.
References
- Bailer-Jones, C. A. L. 2018, A&A, 609, A8 [NASA ADS] [CrossRef] [EDP Sciences] [Google Scholar]
- Booth, M., Kennedy, G., Sibthorpe, B., et al. 2013, MNRAS, 428, 1263 [Google Scholar]
- Chen, C. H., Mittal, T., Kuchner, M., et al. 2014, ApJS, 211, 25 [Google Scholar]
- Cuello, N., Dipierro, G., Mentiplay, D., et al. 2019, MNRAS, 483, 4114 [Google Scholar]
- Cuello, N., Louvet, F., Mentiplay, D., et al. 2020, MNRAS, 491, 504 [Google Scholar]
- De Rosa, R. J., & Kalas, P. 2019, AJ, 157, 125 [CrossRef] [Google Scholar]
- Dent, W. R. F., Greaves, J. S., & Coulson, I. M. 2005, MNRAS, 359, 663 [NASA ADS] [CrossRef] [Google Scholar]
- Dohnanyi, J. S. 1969, J. Geophys. Res., 74, 2531 [Google Scholar]
- Dong, J., Dawson, R. I., Shannon, A., & Morrison, S. 2020, ApJ, 889, 47 [NASA ADS] [CrossRef] [Google Scholar]
- Eilers, A.-C., Hogg, D. W., Rix, H.-W., & Ness, M. K. 2019, ApJ, 871, 120 [Google Scholar]
- Feng, F., Tuomi, M., & Jones, H. R. A. 2017, A&A, 605, A103 [NASA ADS] [CrossRef] [EDP Sciences] [Google Scholar]
- Gaia Collaboration (Prusti, T., et al.) 2016, A&A, 595, A1 [NASA ADS] [CrossRef] [EDP Sciences] [Google Scholar]
- Gaia Collaboration (Brown, A. G. A., et al.) 2021, A&A, 649, A1 [NASA ADS] [CrossRef] [EDP Sciences] [Google Scholar]
- Gilbert, E. A., Barclay, T., Quintana, E. V., et al. 2022, AJ, 163, 147 [NASA ADS] [CrossRef] [Google Scholar]
- Gontcharov, G. A. 2006, Astron. Astrophys. Trans., 25, 145 [NASA ADS] [CrossRef] [Google Scholar]
- Greaves, J. S., Holland, W. S., Wyatt, M. C., et al. 2005, ApJ, 619, L187 [NASA ADS] [CrossRef] [Google Scholar]
- Hughes, A. M., Duchêne, G., & Matthews, B. C. 2018, ARA&A, 56, 541 [Google Scholar]
- Kalas, P. G. 1996, PhD Thesis, Max-Planck-Institute for Astronomy, Heidelberg [Google Scholar]
- Kalas, P., Fitzgerald, M. P., & Graham, J. R. 2007, ApJ, 661, L85 [Google Scholar]
- Kennedy, G. M., Wyatt, M. C., Bryden, G., Wittenmyer, R., & Sibthorpe, B. 2013, MNRAS, 436, 898 [CrossRef] [Google Scholar]
- Kennedy, G. M., Matrà, L., Marmier, M., et al. 2015, MNRAS, 449, 3121 [NASA ADS] [CrossRef] [Google Scholar]
- Kim, M., Wolf, S., Löhne, T., Kirchschlager, F., & Krivov, A. V. 2018, A&A, 618, A38 [NASA ADS] [CrossRef] [EDP Sciences] [Google Scholar]
- Konopacky, Q. M., Rameau, J., Duchêne, G., et al. 2016, ApJ, 829, L4 [Google Scholar]
- Larwood, J. D., & Kalas, P. G. 2001, MNRAS, 323, 402 [NASA ADS] [CrossRef] [Google Scholar]
- Lovell, J. B., Marino, S., Wyatt, M. C., et al. 2021, MNRAS, 506, 1978 [NASA ADS] [CrossRef] [Google Scholar]
- Ma, Y., De Rosa, R. J., & Kalas, P. 2022, AJ, 163, 219 [NASA ADS] [CrossRef] [Google Scholar]
- Marino, S., Zurlo, A., Faramaz, V., et al. 2020, MNRAS, 498, 1319 [Google Scholar]
- Martioli, E., Hébrard, G., Correia, A. C. M., Laskar, J., & Lecavelier des Etangs, A. 2021, A&A, 649, A177 [NASA ADS] [CrossRef] [EDP Sciences] [Google Scholar]
- Meshkat, T., Mawet, D., Bryan, M. L., et al. 2017, AJ, 154, 245 [Google Scholar]
- Moór, A., Kóspál, Á., Ábrahám, P., et al. 2015, MNRAS, 447, 577 [Google Scholar]
- Moore, N. W. H., Li, G., Hassenzahl, L., et al. 2023, ApJ, 943, 6 [NASA ADS] [CrossRef] [Google Scholar]
- Morales, F. Y., Bryden, G., Werner, M. W., & Stapelfeldt, K. R. 2016, ApJ, 831, 97 [Google Scholar]
- Moro-Martín, A., Malhotra, R., Bryden, G., et al. 2010, ApJ, 717, 1123 [Google Scholar]
- Pfalzner, S., & Govind, A. 2021, ApJ, 921, 90 [NASA ADS] [CrossRef] [Google Scholar]
- Picogna, G., & Marzari, F. 2014, A&A, 564, A28 [NASA ADS] [CrossRef] [EDP Sciences] [Google Scholar]
- Plavchan, P., Barclay, T., Gagné, J., et al. 2020, Nature, 582, 497 [Google Scholar]
- Quillen, A. C., Morbidelli, A., & Moore, A. 2007, MNRAS, 380, 1642 [NASA ADS] [CrossRef] [Google Scholar]
- Song, I., Zuckerman, B., & Bessell, M. S. 2012, AJ, 144, 8 [Google Scholar]
- Stassun, K. G., Oelkers, R. J., Paegert, M., et al. 2019, AJ, 158, 138 [Google Scholar]
- Thebault, P., Kral, Q., & Olofsson, J. 2021, A&A, 646, A173 [NASA ADS] [CrossRef] [EDP Sciences] [Google Scholar]
- van der Plas, G., Ménard, F., Gonzalez, J. F., et al. 2019, A&A, 624, A33 [NASA ADS] [CrossRef] [EDP Sciences] [Google Scholar]
- Vican, L., Schneider, A., Bryden, G., et al. 2016, ApJ, 833, 263 [NASA ADS] [CrossRef] [Google Scholar]
- Wittrock, J. M., Dreizler, S., Reefe, M. A., et al. 2022, AJ, 164, 27 [NASA ADS] [CrossRef] [Google Scholar]
- Wittrock, J. M., Plavchan, P., Cale, B. L., et al. 2023, ArXiv e-prints [arXiv:2302.04922] [Google Scholar]
- Wyatt, M. C., Smith, R., Greaves, J. S., et al. 2007, ApJ, 658, 569 [NASA ADS] [CrossRef] [Google Scholar]
- Xuan, J. W., Kennedy, G. M., Wyatt, M. C., & Yelverton, B. 2020, MNRAS, 499, 5059 [NASA ADS] [CrossRef] [Google Scholar]
Appendix A: Additional material
In this section, we show some additional material complementary to the results discussed in the main body of this letter. In particular, the histograms of single and multiple flybys as a function of the spectral type and age of the main source are shown in Figure A.1, highlighting the close encounters. Table A.1 shows the first lines of a complete table given online, where we show the results of all the perturbers responsible for a flyby for each debris disk system.
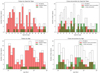 |
Fig. A.1. Distribution of ages and spectral types of flybys and close encounters in the last 5 Myrs. |
Distance and time of the flybys found for each debris disk system highlighting whether they belong to an association or to with part of the sky considered. Close encounters correspond to the [*] points in the first column. Names in bold are objects with FIR excess. The full table is available at the CDS.
All Tables
Masses (from Stassun et al. 2019) of the main objects are given in the first column, while the computed Hill Radii and errors in the second and third columns.
Distance and time of the flybys found for each debris disk system highlighting whether they belong to an association or to with part of the sky considered. Close encounters correspond to the [*] points in the first column. Names in bold are objects with FIR excess. The full table is available at the CDS.
All Figures
|
Fig. 1. Sizes of the resolved debris disk systems and the positions of planets, companions, and flybys from the central object. On the x-axis, the projected distance from the main star is given in AU. In the y-axis, all systems with resolved debris disks are listed. The panel overlaid in the figure explains the different symbols and colors. |
| In the text | |
|
Fig. A.1. Distribution of ages and spectral types of flybys and close encounters in the last 5 Myrs. |
| In the text | |
Current usage metrics show cumulative count of Article Views (full-text article views including HTML views, PDF and ePub downloads, according to the available data) and Abstracts Views on Vision4Press platform.
Data correspond to usage on the plateform after 2015. The current usage metrics is available 48-96 hours after online publication and is updated daily on week days.
Initial download of the metrics may take a while.