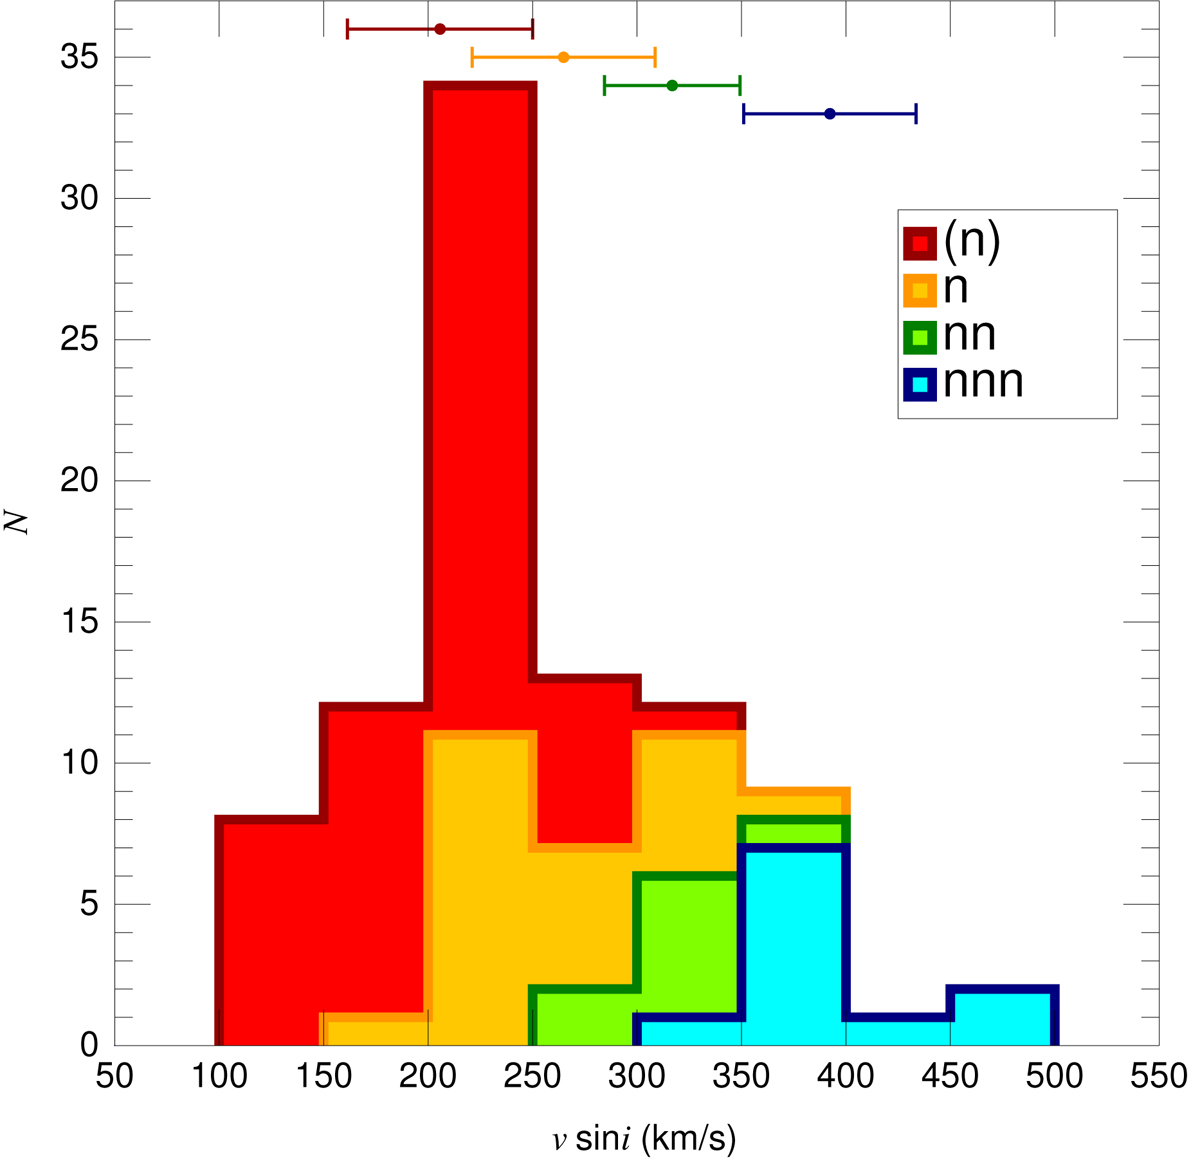
Fig. 5.
Download original image
v sin i histogram of those OB stars with any rotation index in their spectral classification. Broadening is denoted by (n), n, nn, and nnn indexes, progressing from slightly broadened to more broadened lines. Points and horizontal lines at the top of the figure indicate the mean v sin i value for each rotating group and the corresponding dispersion, respectively.
Current usage metrics show cumulative count of Article Views (full-text article views including HTML views, PDF and ePub downloads, according to the available data) and Abstracts Views on Vision4Press platform.
Data correspond to usage on the plateform after 2015. The current usage metrics is available 48-96 hours after online publication and is updated daily on week days.
Initial download of the metrics may take a while.