Fig. 2.
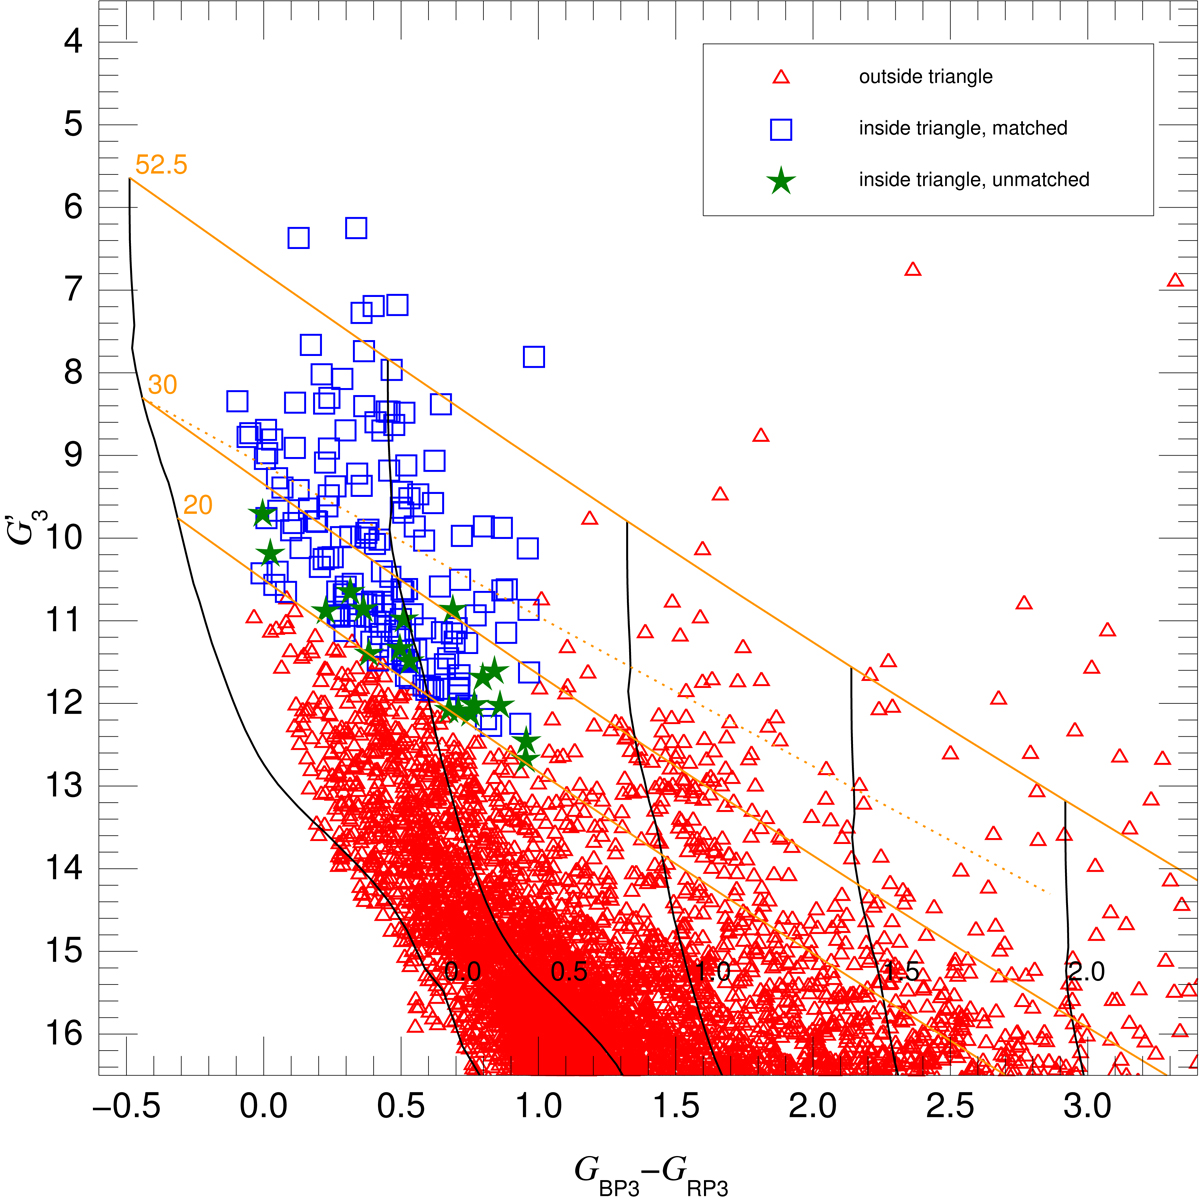
Download original image
Second panel (see previous page for the first one): Equivalent plot but for all Gaia EDR3 stars in the region of interest with corrected parallaxes that are compatible with the distance to Car OB1 and positive, and with catalog values of GBP3 − GRP3. The plotted objects are classified according to whether they are located inside or outside of the area limited by GBP3 − GRP3 = 1.0 and the R5495 = 4.5 extinction track for average MS stars with Teff = 20 kK. Stars inside that area are further divided into those matched with objects in the first panel (154) and those unmatched (19). We note that an additional three stars inside the above-mentioned area in the first panel (HD 93 129 Ab, CPD −59 2636 A,B, and ALS 19 740) plus η Car outside of that area are not shown either because they are not included in Gaia EDR3 or have no parallaxes there.
Current usage metrics show cumulative count of Article Views (full-text article views including HTML views, PDF and ePub downloads, according to the available data) and Abstracts Views on Vision4Press platform.
Data correspond to usage on the plateform after 2015. The current usage metrics is available 48-96 hours after online publication and is updated daily on week days.
Initial download of the metrics may take a while.