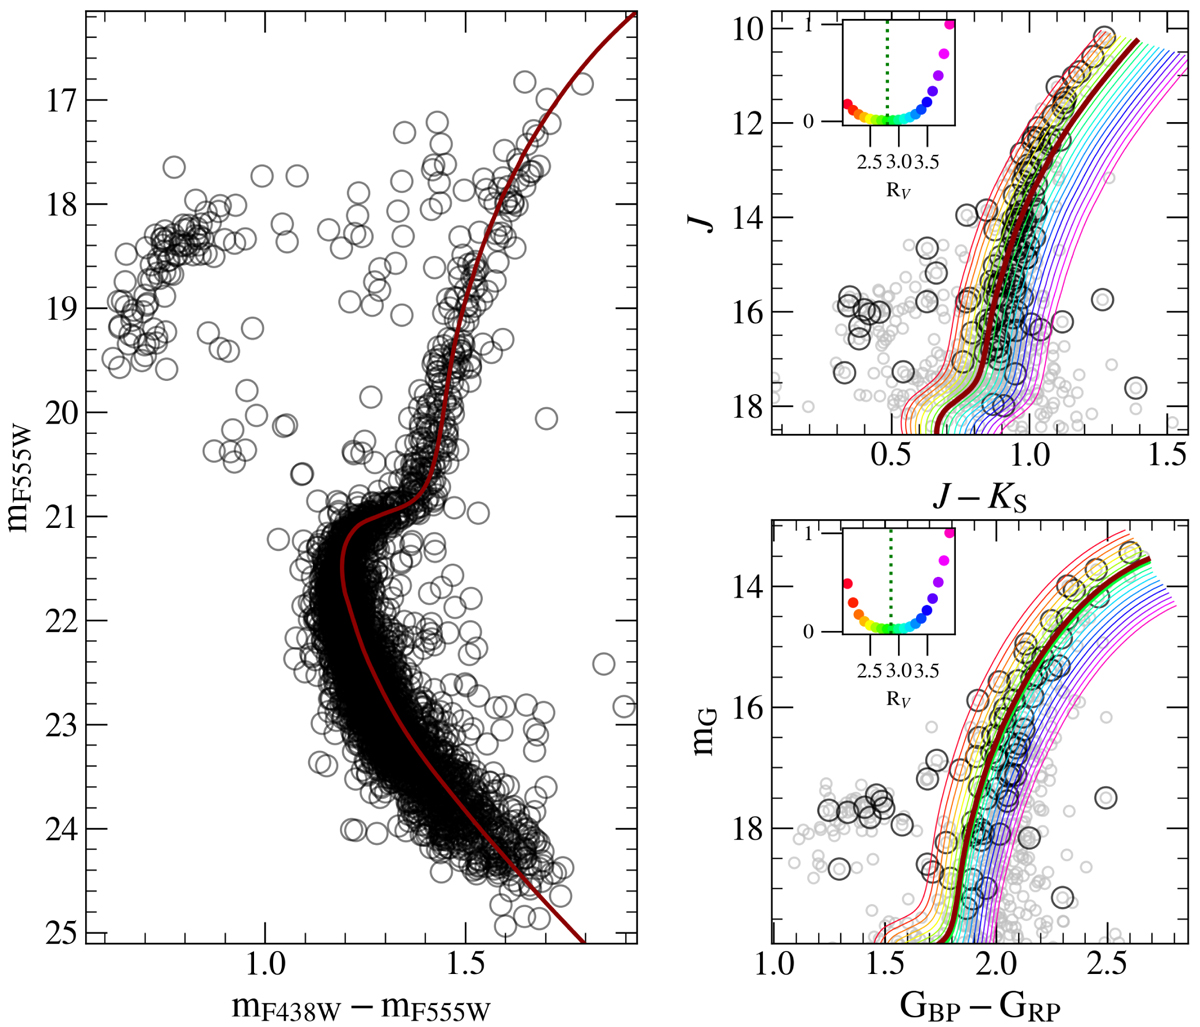
Fig. 7.
Download original image
Simultaneous isochrone fitting to derive the cluster RV using three CMDs: HST (left panel), 2MASS JKS from Valenti et al. (2007) (top right panel), and Gaia DR3 (bottom right panel). The isochrones are coloured according to their RV value. In each panel, the best solution is represented by the solid dark red isochrone. For the two right panels, the χ2 analysis is plotted in the inset plot, and the dots are coloured by the same colour as the corresponding isochrone.
Current usage metrics show cumulative count of Article Views (full-text article views including HTML views, PDF and ePub downloads, according to the available data) and Abstracts Views on Vision4Press platform.
Data correspond to usage on the plateform after 2015. The current usage metrics is available 48-96 hours after online publication and is updated daily on week days.
Initial download of the metrics may take a while.