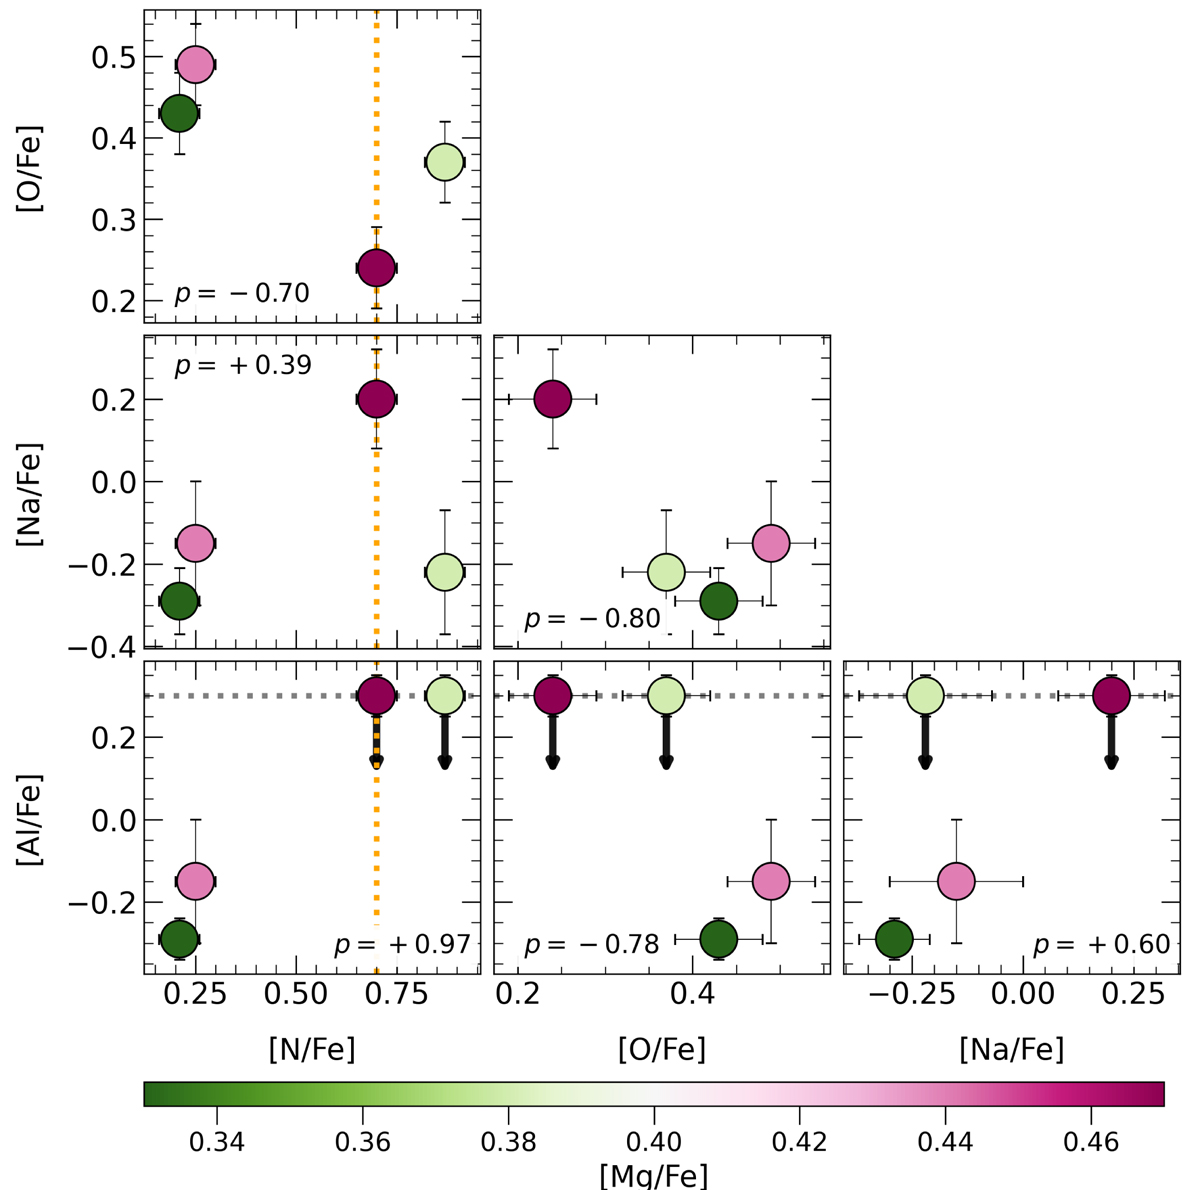
Fig. 12.
Download original image
(Anti-)Correlations indicating effects of multiple stellar populations. The dotted orange line in both left panels represents the transition to the N-rich regime at [N/Fe] ∼ 0.7 for [Fe/H] around the NGC 6355 value (Fernández-Trincado et al. 2022). Additionally, the grey line in the two bottom panels shows the upper limit for first-generation stars (Mészáros et al. 2020). The colour bar shows the Mg abundances.
Current usage metrics show cumulative count of Article Views (full-text article views including HTML views, PDF and ePub downloads, according to the available data) and Abstracts Views on Vision4Press platform.
Data correspond to usage on the plateform after 2015. The current usage metrics is available 48-96 hours after online publication and is updated daily on week days.
Initial download of the metrics may take a while.