Fig. 9
Download original image
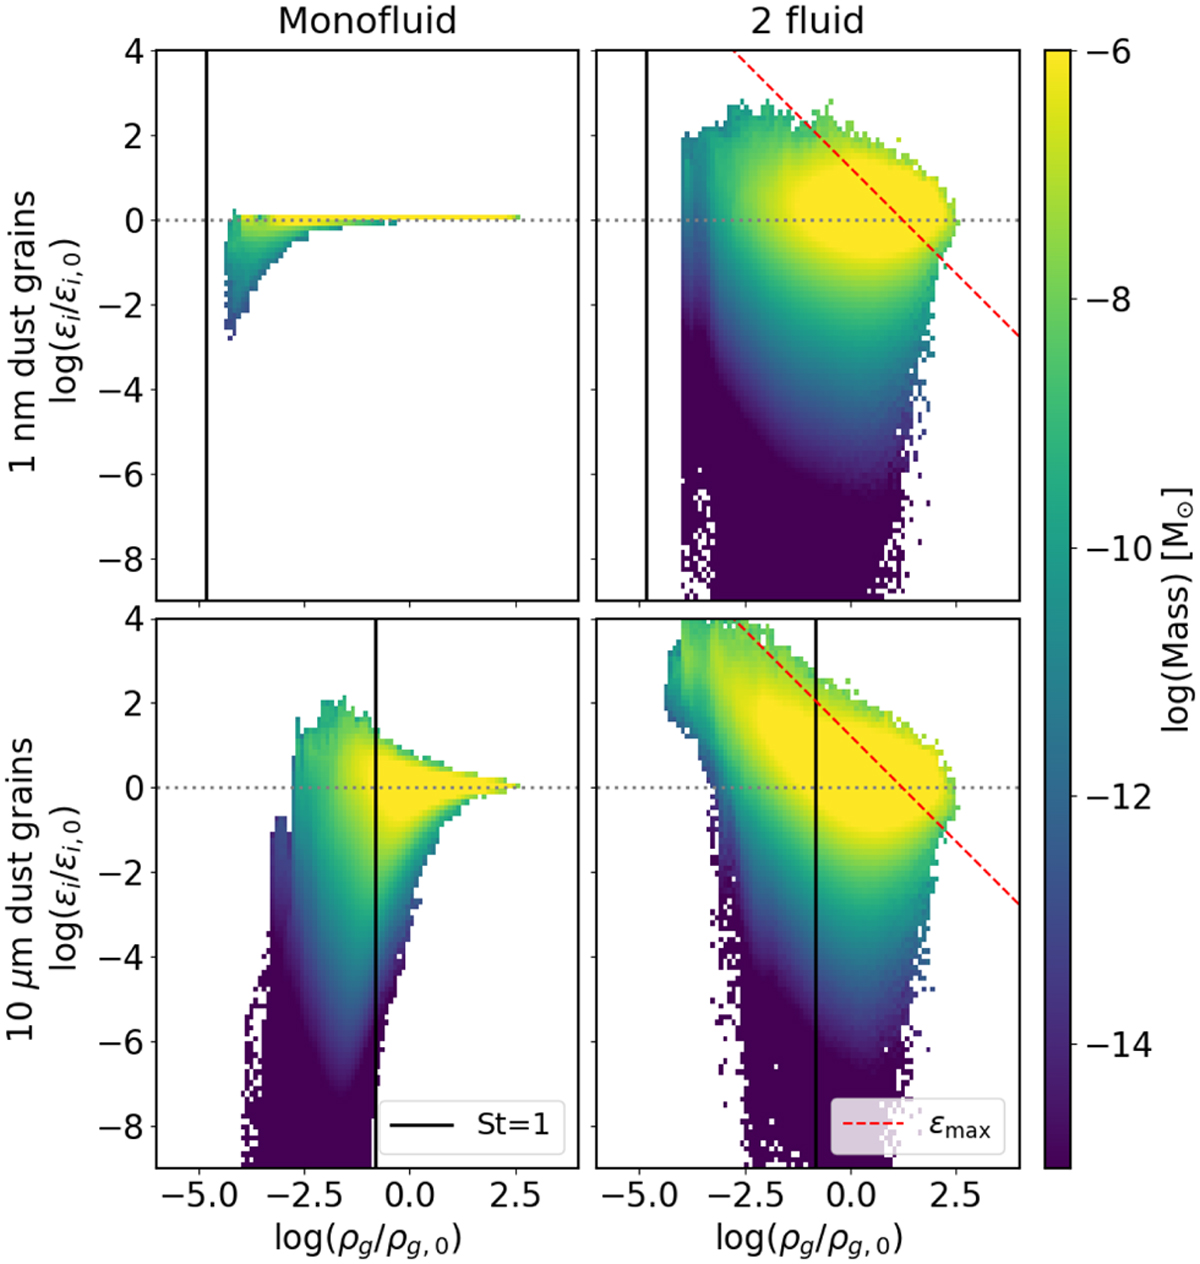
Same as Fig. 3 but for the 256_2F run. The left column shows the monofluid results and the right column shows the results when dust is modelled as Lagrangian particles. The top row shows the 1 nm dust grains and the bottom row the 10 μm dust grains. The red dashed line indicates the maximum dust enrichment as defined in Eq. (17). All the material that is above this line has an excessive dust concentration.
Current usage metrics show cumulative count of Article Views (full-text article views including HTML views, PDF and ePub downloads, according to the available data) and Abstracts Views on Vision4Press platform.
Data correspond to usage on the plateform after 2015. The current usage metrics is available 48-96 hours after online publication and is updated daily on week days.
Initial download of the metrics may take a while.