Fig. 7
Download original image
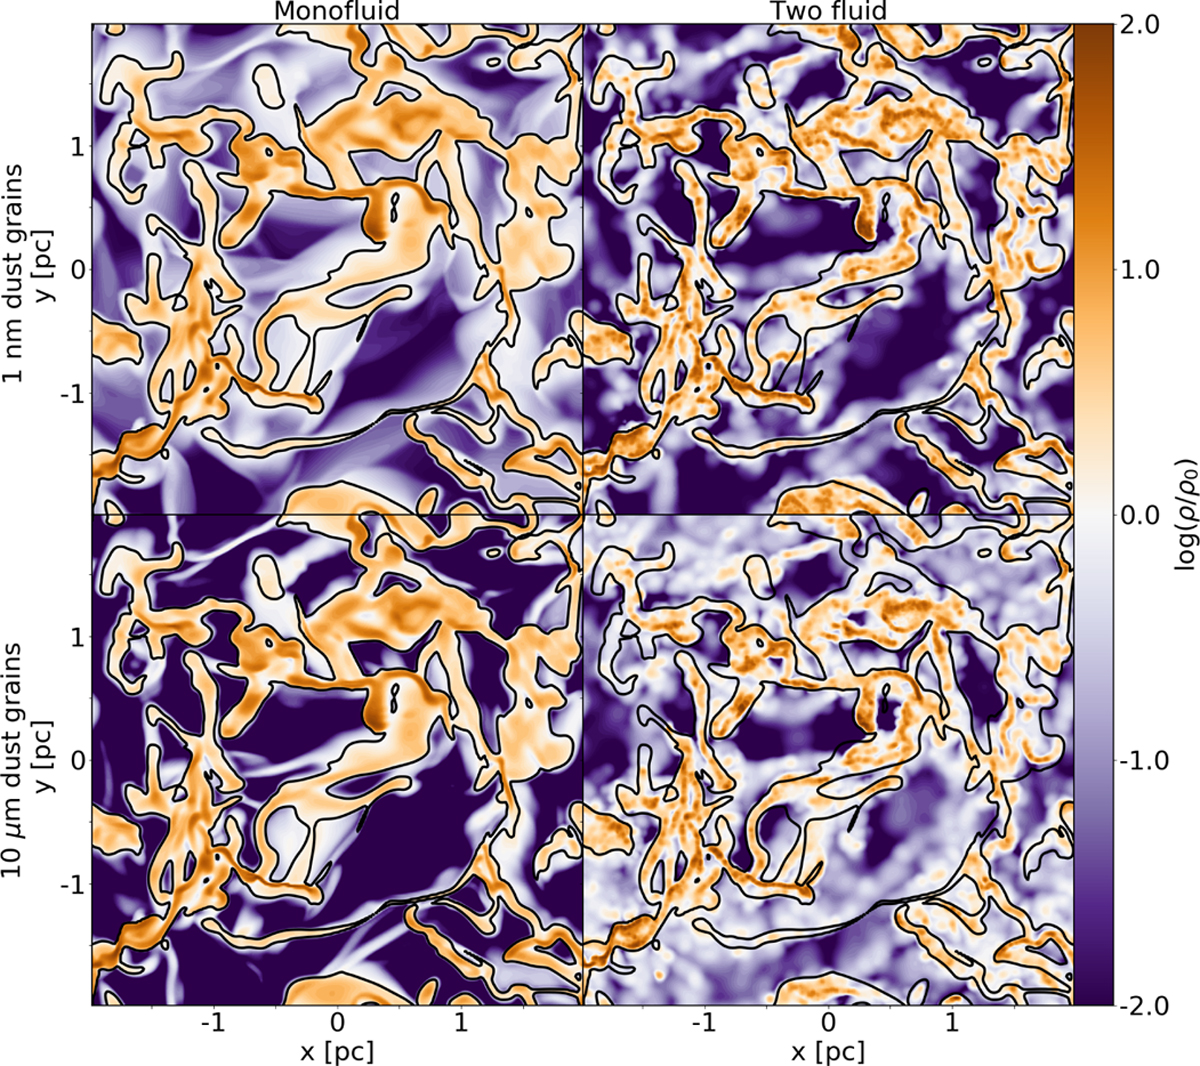
Density slice in the z = 0 plane obtained from the 256_2F run for the 1 nm (top) and 10 μm (bottom) dust grains at a time corresponding to ≃ 4.5tcross. The left column represents the density field of the monofluid dust, while the right column represents the density field interpolated from the Lagrangian dust particles. The density is normalised by the initial density ρ0. The black lines represent the contour for which the gas density is equal to its initial value ρ0.
Current usage metrics show cumulative count of Article Views (full-text article views including HTML views, PDF and ePub downloads, according to the available data) and Abstracts Views on Vision4Press platform.
Data correspond to usage on the plateform after 2015. The current usage metrics is available 48-96 hours after online publication and is updated daily on week days.
Initial download of the metrics may take a while.