Fig. 3
Download original image
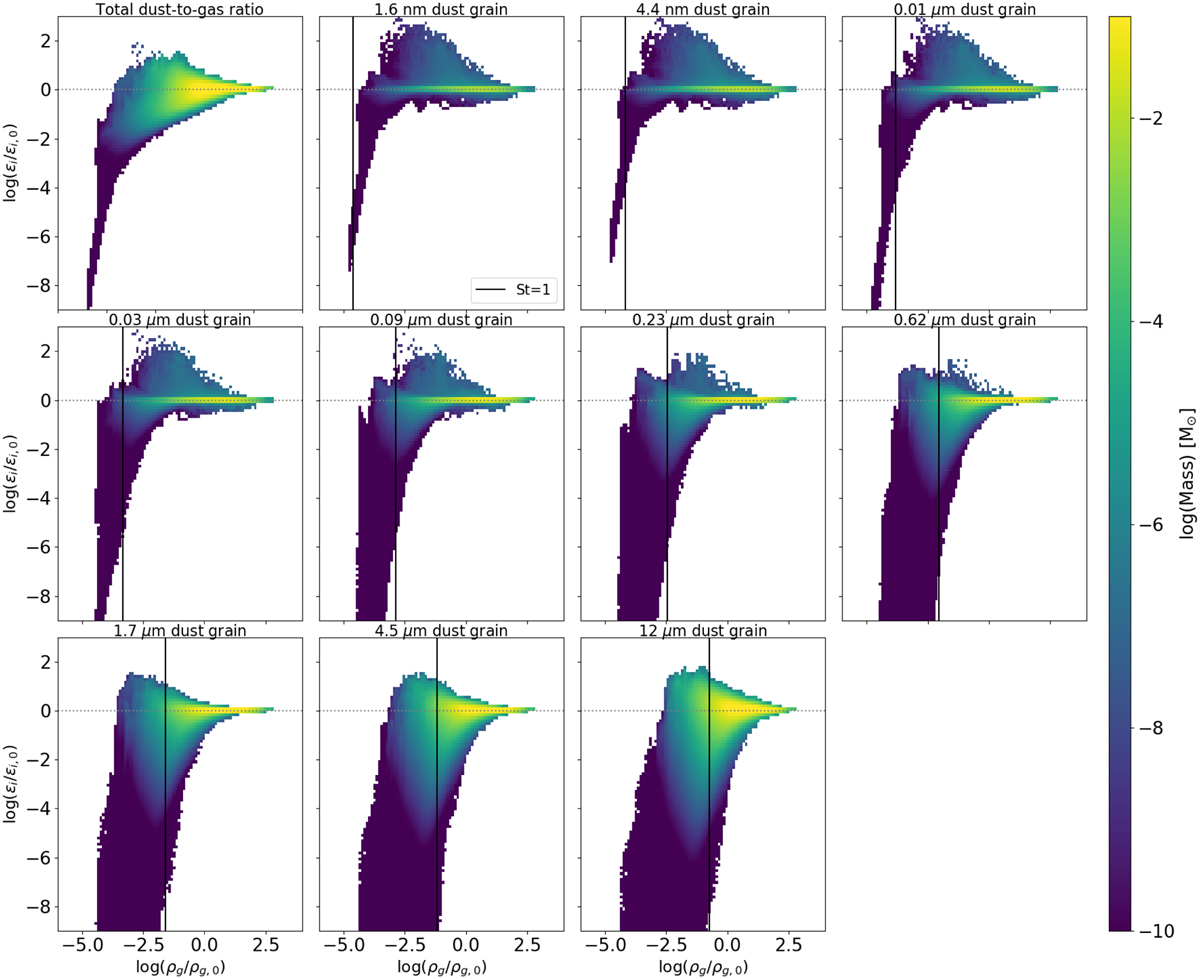
2D histograms of the dust-ratio variations as a function of gas density for the fiducial model 256MRN. The top-left panel shows the variation in total dust-to-gas ratio ɛ, while the other panels show the dust-ratio variations of each dust species. The colour coding indicates the mass of the gas in log scale (in solar units). The horizontal grey dotted line separates the dust-enriched and dust-depleted regions. The vertical line indicates St = 1 (solid) for each dust species. All quantities are averaged over more than one dynamical time tcross and the variations are normalised to the initial value of each dust ratio.
Current usage metrics show cumulative count of Article Views (full-text article views including HTML views, PDF and ePub downloads, according to the available data) and Abstracts Views on Vision4Press platform.
Data correspond to usage on the plateform after 2015. The current usage metrics is available 48-96 hours after online publication and is updated daily on week days.
Initial download of the metrics may take a while.