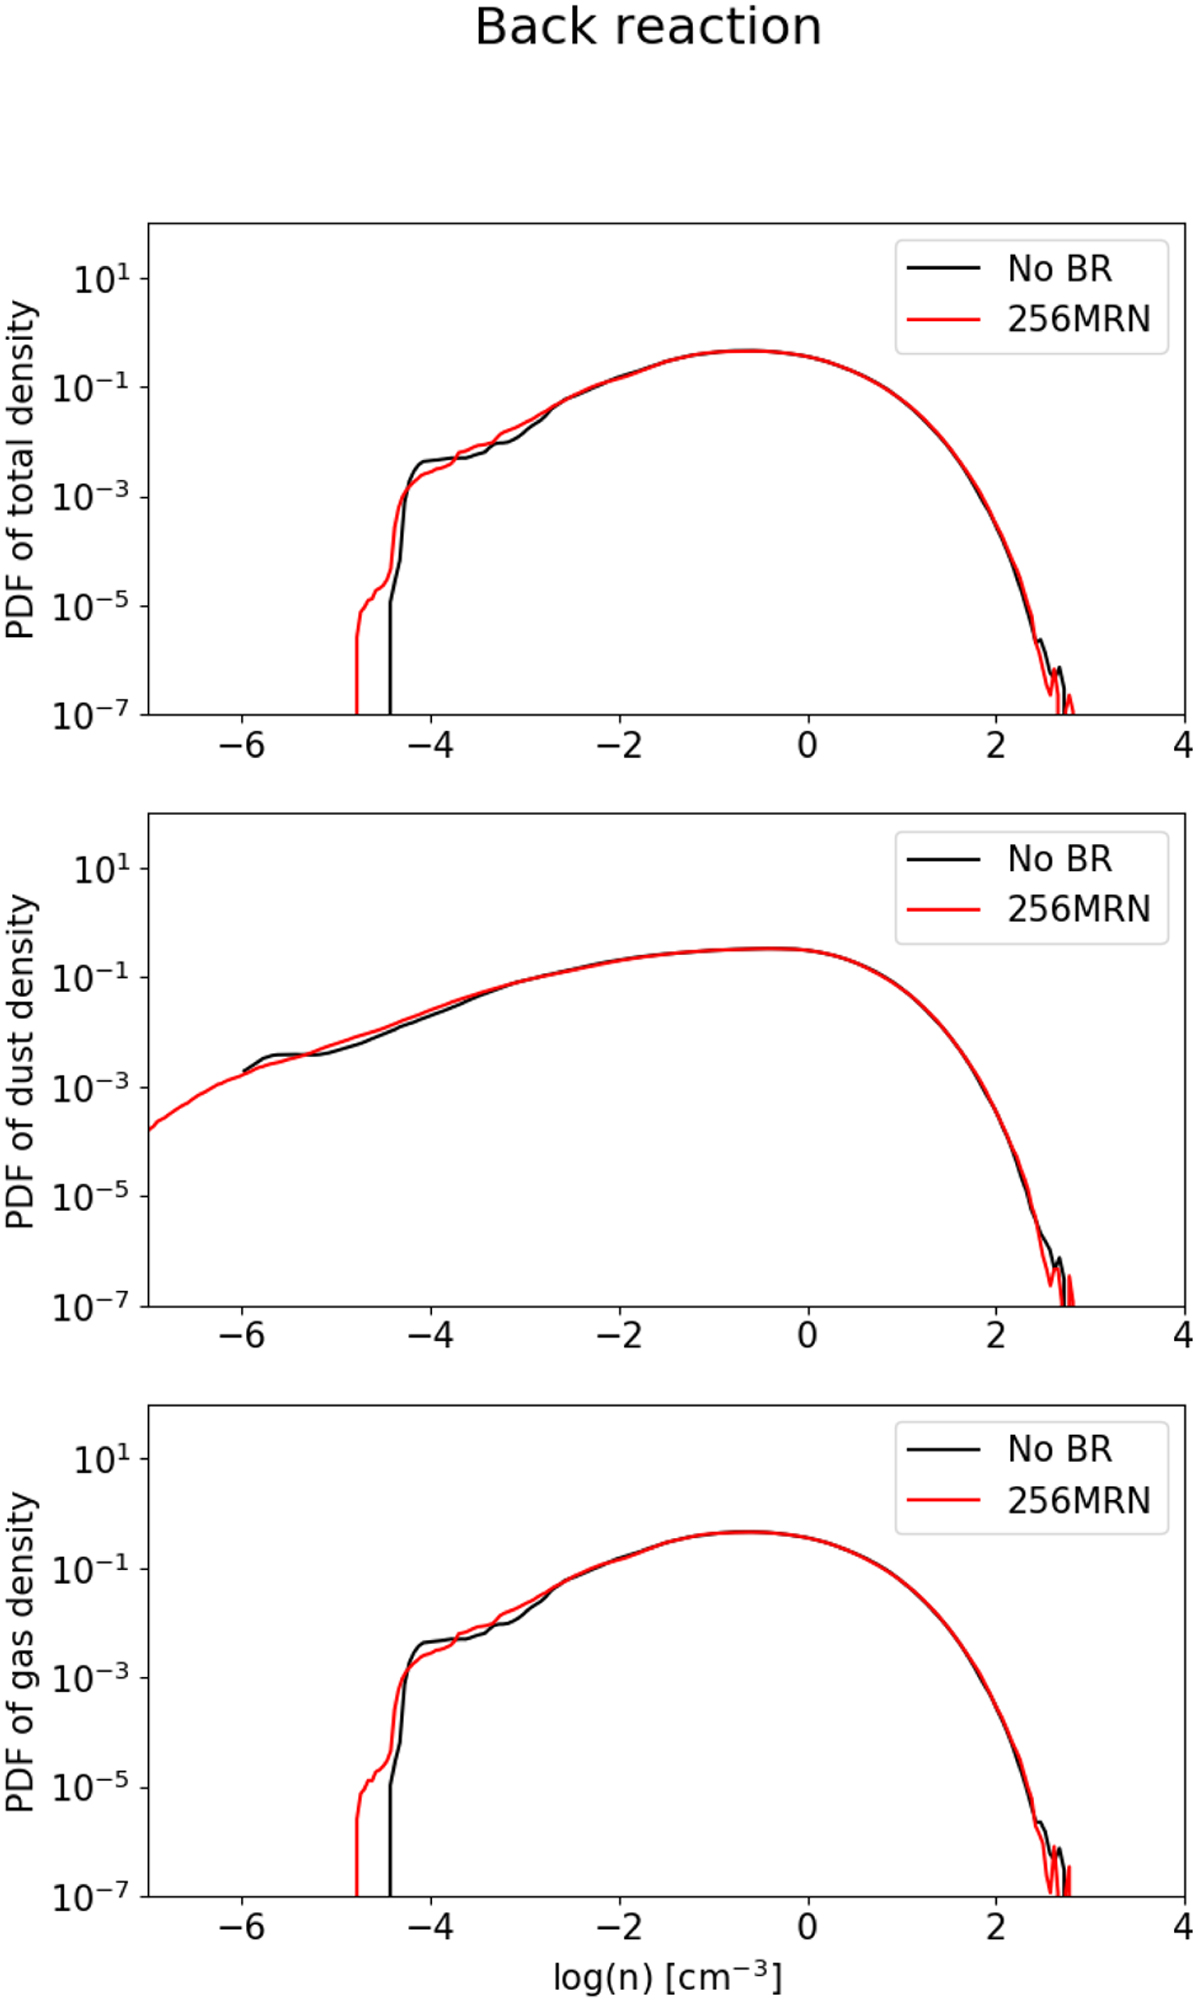
Fig. B.1
Download original image
PDFs of the total (gas + dust) density (top), total dust density (middle), and gas density (bottom) variations for the 256MRN (fiducial, red) run and for the same model but with an initial dust-to-gas ratio to 10−6 (black). All quantities are averaged over more than one crossing time. The different densities are normalised to their initial values.
Current usage metrics show cumulative count of Article Views (full-text article views including HTML views, PDF and ePub downloads, according to the available data) and Abstracts Views on Vision4Press platform.
Data correspond to usage on the plateform after 2015. The current usage metrics is available 48-96 hours after online publication and is updated daily on week days.
Initial download of the metrics may take a while.