Fig. A.1
Download original image
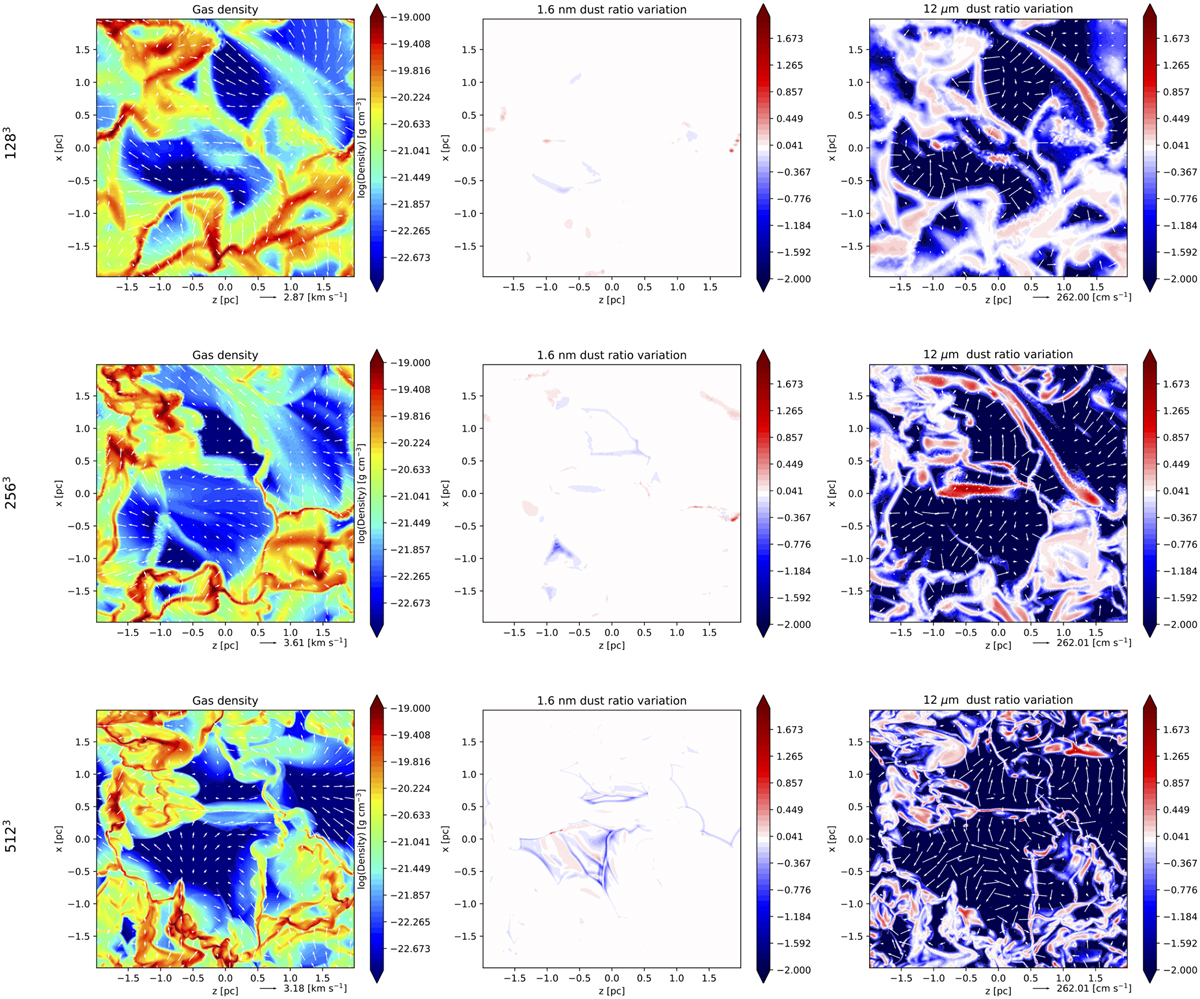
Total density (left), 1.6 nm dust-grain-ratio variations (middle), and 12 μm dust-grain-ratio variation maps in the xz-plane for different resolutions: 1283 (top), 2563 (middle) and 5123 (bottom). The dust variation is given relative to the initial dust ratio value and is shown in logarithmic scale. The red colour shows dust-ratio enhancement while blue means a dust-ratio decrease. The arrows represent the barycentric velocity (left), and the 1.6 nm (middle) and 12 μm dust-grain (right) velocity vectors in the plane. All plots are made at a time corresponding to 2tcross.
Current usage metrics show cumulative count of Article Views (full-text article views including HTML views, PDF and ePub downloads, according to the available data) and Abstracts Views on Vision4Press platform.
Data correspond to usage on the plateform after 2015. The current usage metrics is available 48-96 hours after online publication and is updated daily on week days.
Initial download of the metrics may take a while.