Open Access
Fig. 12
Download original image
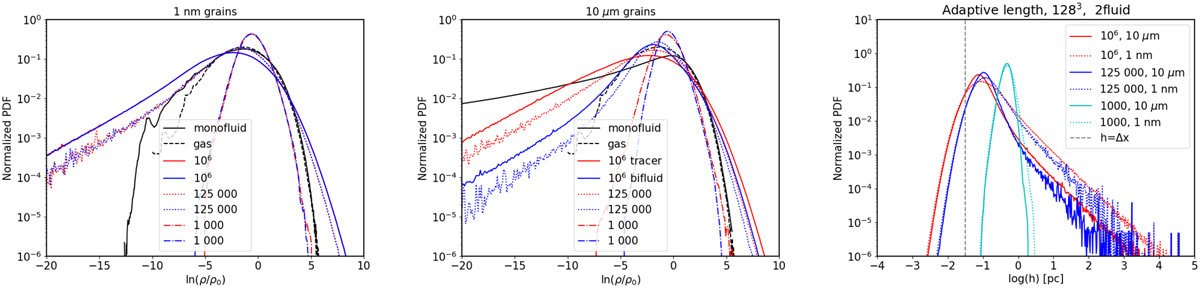
Same as Fig. 11 for the 128_2F, 128_2F_LR, and 128_2F_VLR models. In the density PDFs, the blue lines indicate the results for the two fluid dust Lagrangian-particle distribution while the red lines indicate the tracer particle ones.
Current usage metrics show cumulative count of Article Views (full-text article views including HTML views, PDF and ePub downloads, according to the available data) and Abstracts Views on Vision4Press platform.
Data correspond to usage on the plateform after 2015. The current usage metrics is available 48-96 hours after online publication and is updated daily on week days.
Initial download of the metrics may take a while.