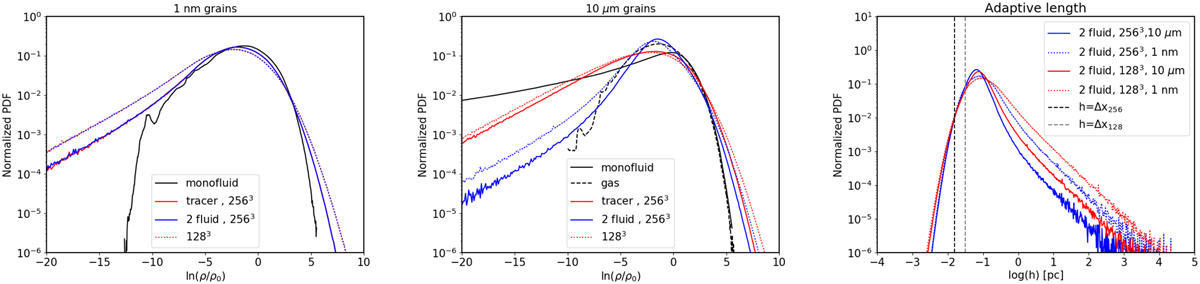
Fig. 11
Download original image
PDF of the dust density of the 1 nm (left) and 10 μm (middle). The colour coding indicates the dust fluid treatment (two fluid Lagrangian particles in blue, tracer particles in red, monofluid in black). For clarity, only the monofluid quantities of the 256_2F are shown. The solid lines show the results of the 256_2F run, while the dotted lines show the results of the 128_2F. Right: PDF of the adaptive length of the two-fluid dust Lagrangian-particle distributions (solid lines for the 10 μm dust grains, dotted line for the 1 nm) for the 256_2F (blue) and 128_2F (red) models. The vertical dashed lines indicate the grid numerical resolution (black for 256_2F, grey fro 128_2F).
Current usage metrics show cumulative count of Article Views (full-text article views including HTML views, PDF and ePub downloads, according to the available data) and Abstracts Views on Vision4Press platform.
Data correspond to usage on the plateform after 2015. The current usage metrics is available 48-96 hours after online publication and is updated daily on week days.
Initial download of the metrics may take a while.