Fig. 1
Download original image
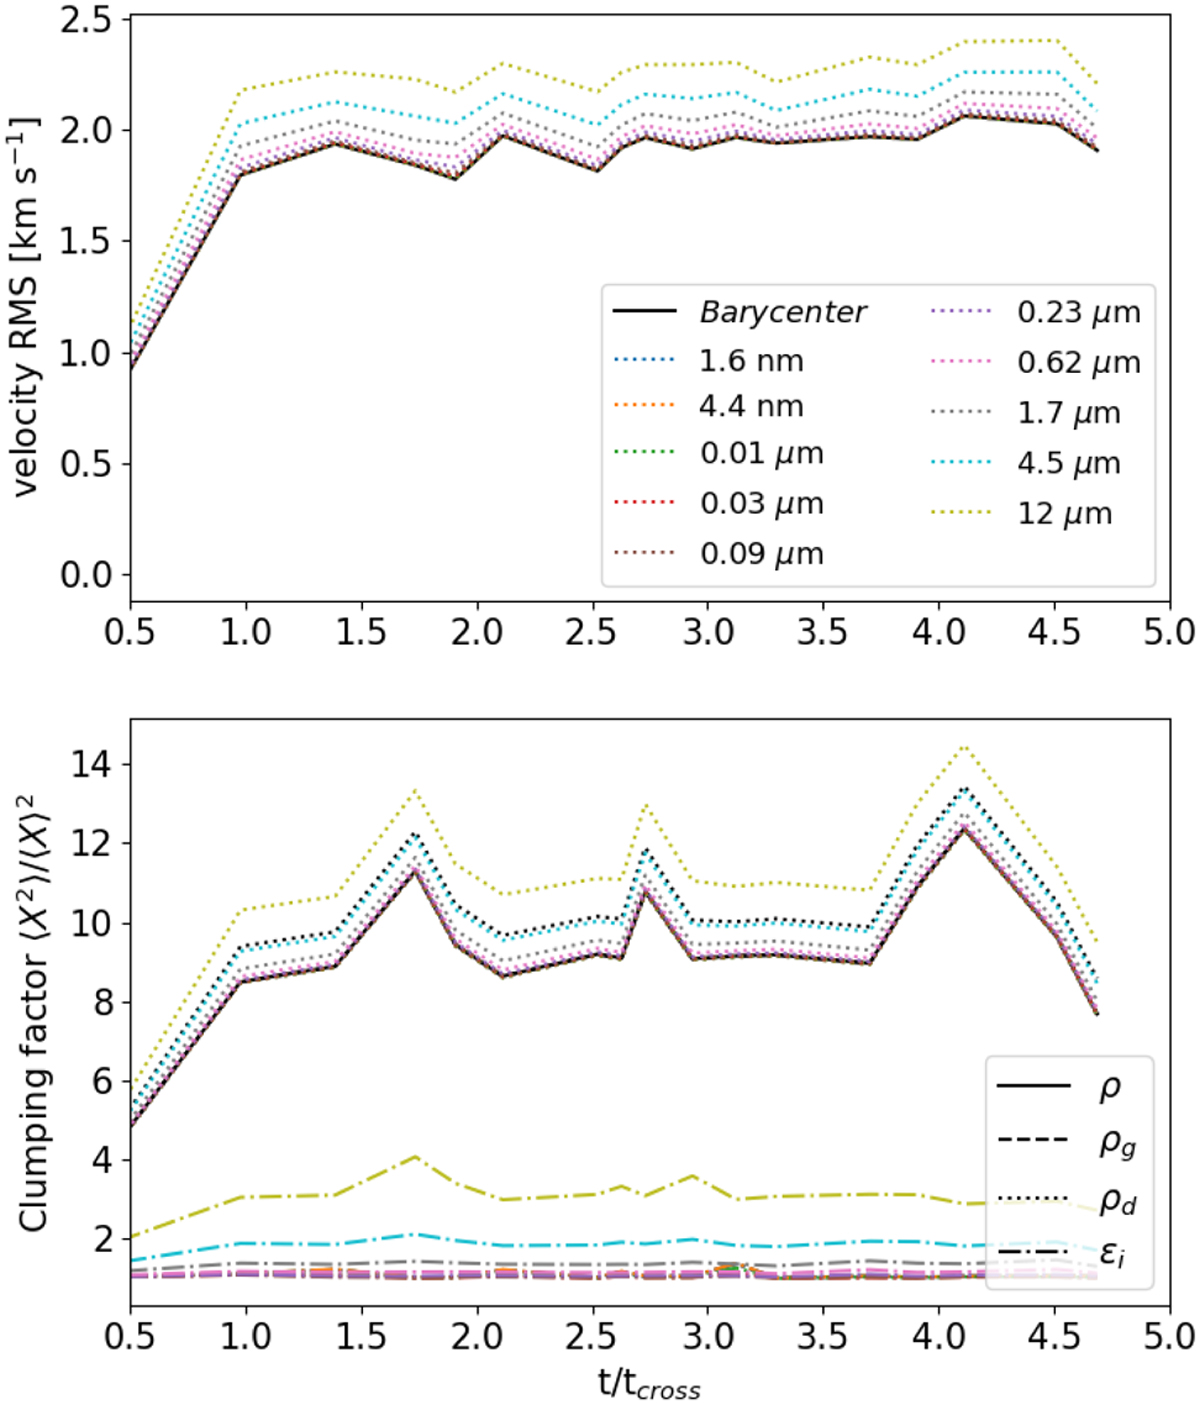
Time evolution of the barycentre and dust-species RMS velocity (top) and of the clumping factor of the density of the different species (bottom) in the fiducial model 256MRN. The time evolution has been normalised according to the turbulent crossing time tcross. In the bottom panel, the dotted line shows the clumping factor evolution of the total dust density ρd and the dashed-dotted line shows the clumping factor evolution of each dust species concentration ϵi. The evolution of the clumping factor of the gas density (dashed) is indistinguishable from that of the barycentre (solid) density.
Current usage metrics show cumulative count of Article Views (full-text article views including HTML views, PDF and ePub downloads, according to the available data) and Abstracts Views on Vision4Press platform.
Data correspond to usage on the plateform after 2015. The current usage metrics is available 48-96 hours after online publication and is updated daily on week days.
Initial download of the metrics may take a while.