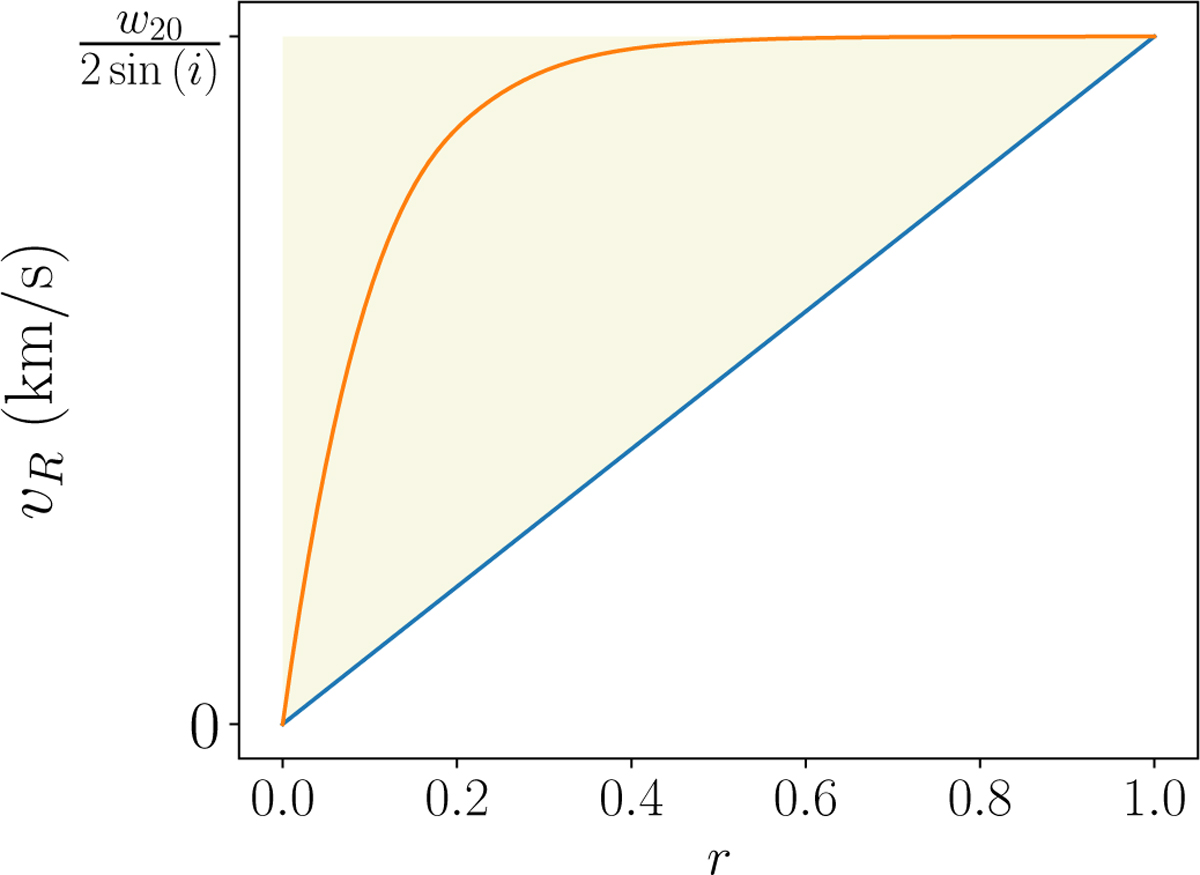
Fig. A.1
Download original image
Velocity profiles covered by the mask (yellow shaded area), accompanied by two examples of velocity profiles (orange and blue lines). The two examples are a subset of all the velocity profiles that fit inside the yellow shaded area and thereby are represented by the mask. The horizontal axis shows the distance to the galaxy center r and the vertical axis displays the orbital speed vR. We note that r is a normalized value between 0 and 1, where 0 is the galaxy center and 1 is the edge.
Current usage metrics show cumulative count of Article Views (full-text article views including HTML views, PDF and ePub downloads, according to the available data) and Abstracts Views on Vision4Press platform.
Data correspond to usage on the plateform after 2015. The current usage metrics is available 48-96 hours after online publication and is updated daily on week days.
Initial download of the metrics may take a while.