Fig. 8
Download original image
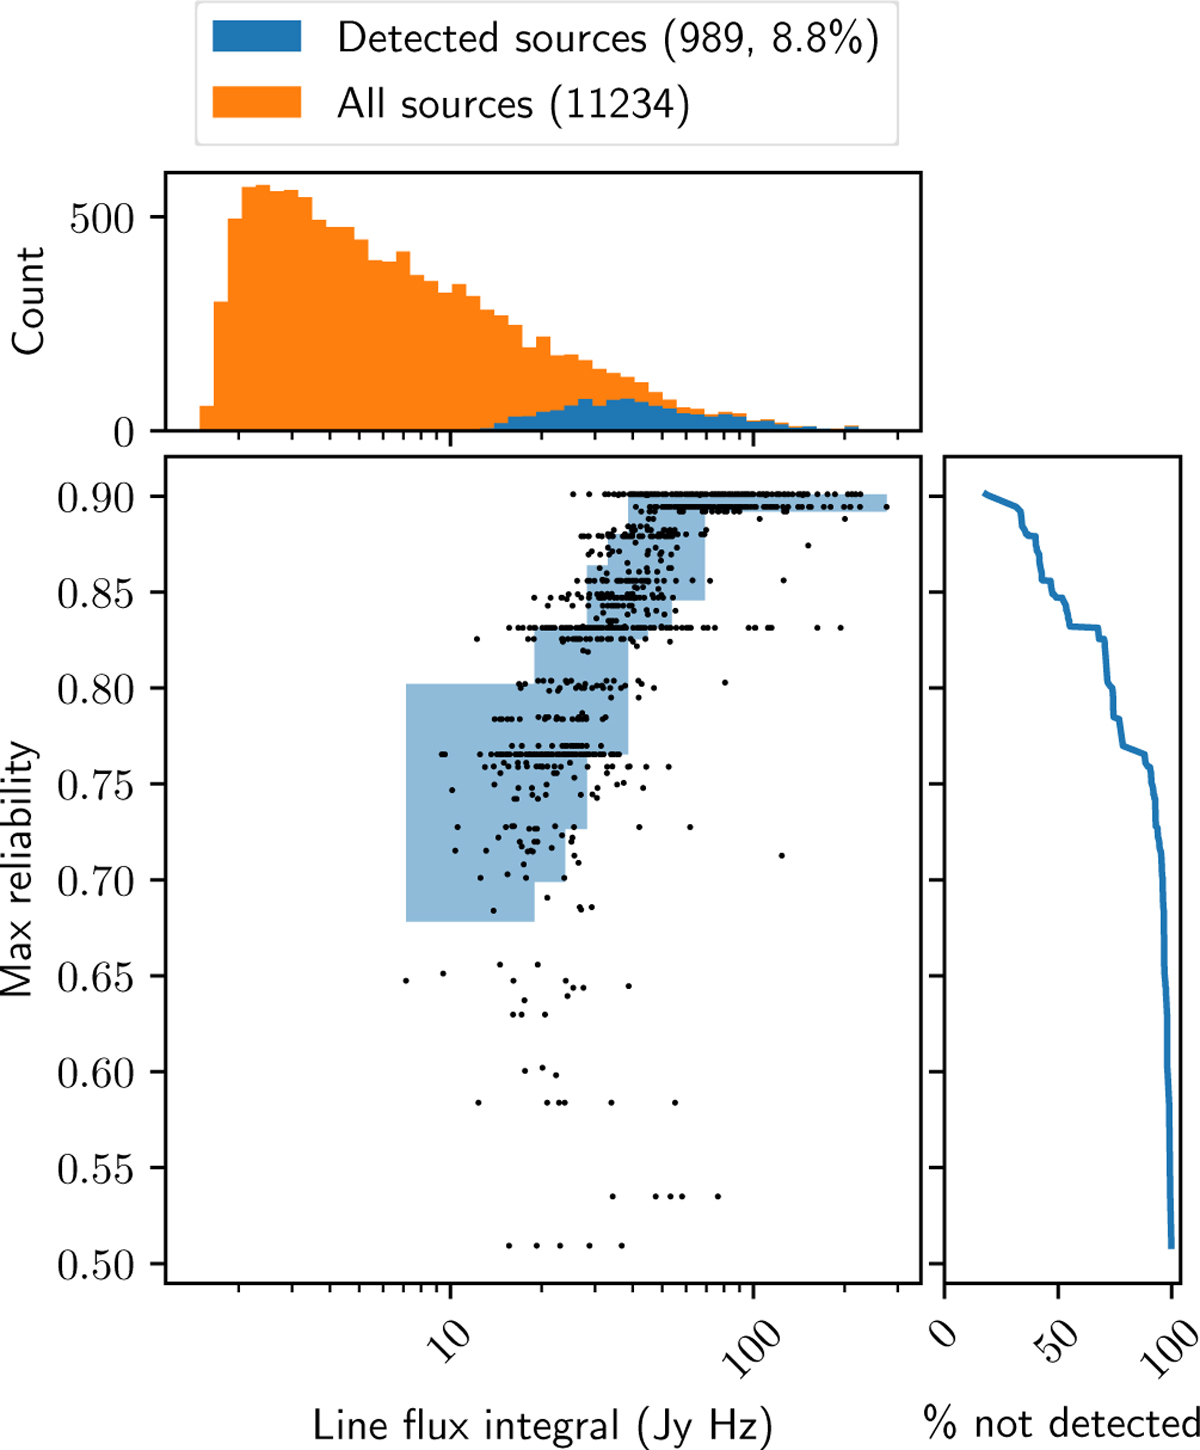
Maximum catalog reliability among true sources detected by at least one predicted source catalog. Each dot represents a detected true source, located horizontally by its line flux integral and vertically by the maximum reliability. The blue background in the scatter plot shows the range between the 10th and the 90th percentile in maximum reliability of ten equally sized sets of detected sources, grouped by the line flux integral. The top histogram compares the integrated line flux distributions of all sources in the true source catalog with all detected sources. The right-hand side plot shows the cumulative fraction of detected sources, starting from the sources with highest max reliability.
Current usage metrics show cumulative count of Article Views (full-text article views including HTML views, PDF and ePub downloads, according to the available data) and Abstracts Views on Vision4Press platform.
Data correspond to usage on the plateform after 2015. The current usage metrics is available 48-96 hours after online publication and is updated daily on week days.
Initial download of the metrics may take a while.