Fig. 7
Download original image
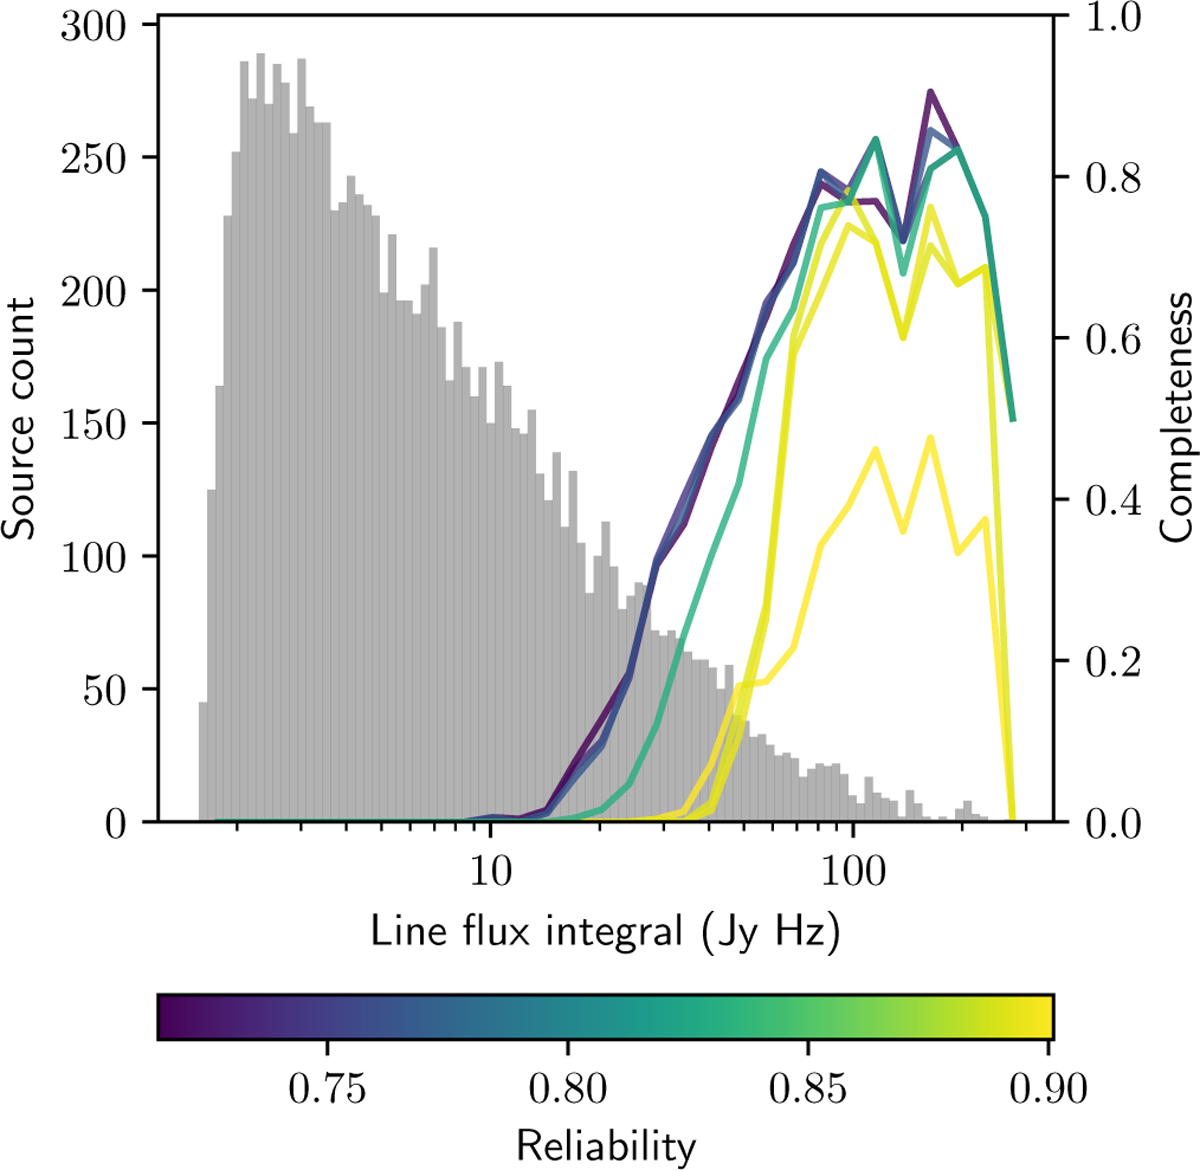
Completeness in bins of integrated line flux of the sets of parameter with best ranking 1 in Fig. 6. Completeness for each line and level of integrated flux is shown on the right vertical axis, while the overall reliability of the set is given by the line color. The histogram in gray shows the distribution of all sources in the test set, with counts on the left vertical axis. We note that the scale on the horizontal axis is logarithmic.
Current usage metrics show cumulative count of Article Views (full-text article views including HTML views, PDF and ePub downloads, according to the available data) and Abstracts Views on Vision4Press platform.
Data correspond to usage on the plateform after 2015. The current usage metrics is available 48-96 hours after online publication and is updated daily on week days.
Initial download of the metrics may take a while.