Fig. 6
Download original image
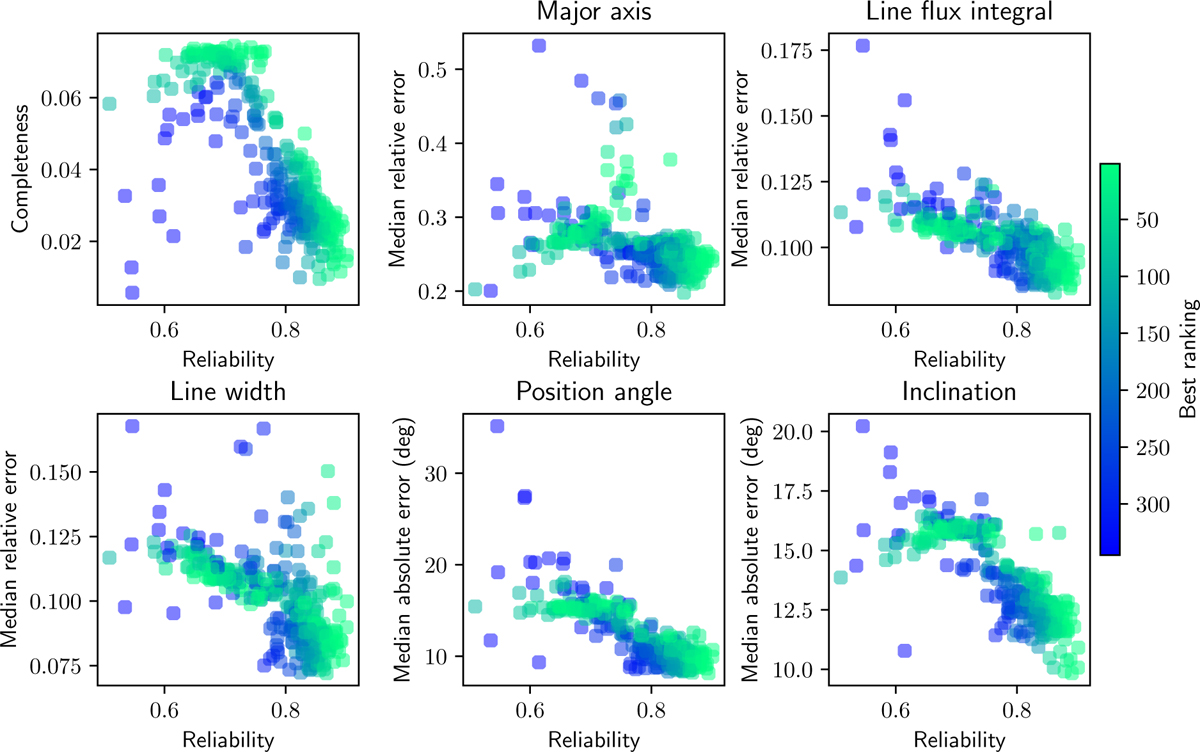
Performance of the sampled sets of parameter values for step II. Each dot represent a single set of parameter values, as listed in Table 2, and its color is set by the best ranking (see text). The best forming set of parameter values, that have a small best ranking value, are colored green, while the worst with a large best ranking are colored in blue. The upper left plot shows completeness C as defined in Eq. (7) and reliability, R, as defined in Eq. (6), on the vertical and horizontal axis, respectively. In each of the other five plots, the attribute errors are plotted on the vertical axis, with reliability, R, on the horizontal axis. For major axis, line flux integral and line width, the value on the vertical axis is the median relative error. For the position angle and inclination, the value on the vertical axis is the median absolute error. For a predicted value of ŷ and a true value of y, the relative error is given by |ŷ – y|/y, while the absolute error is given by |ŷ – y|.
Current usage metrics show cumulative count of Article Views (full-text article views including HTML views, PDF and ePub downloads, according to the available data) and Abstracts Views on Vision4Press platform.
Data correspond to usage on the plateform after 2015. The current usage metrics is available 48-96 hours after online publication and is updated daily on week days.
Initial download of the metrics may take a while.