Fig. 5
Download original image
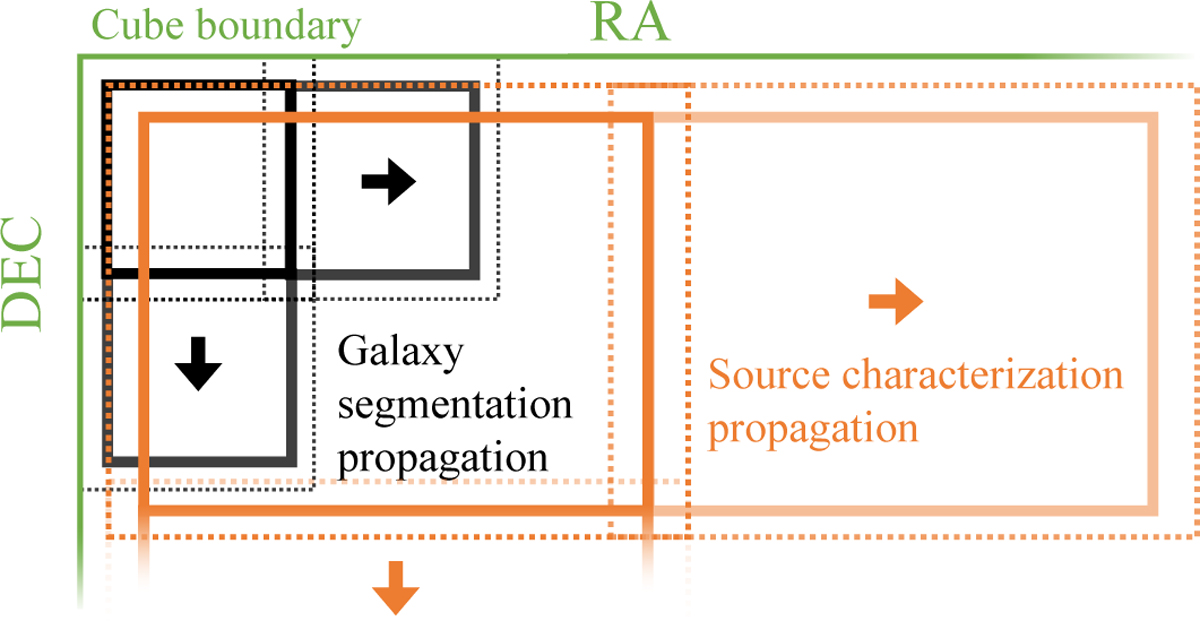
Illustration of the arrangement of subsets of the full cube when applying the pipeline, projected into the two spatial dimensions. In the pipeline, this arrangement was also applied in the frequency dimension. Green lines denote the cube boundary, black and grey the regions processed in one batch of the galaxy segmentation step, and orange for one batch of the source characterization step. Dashed lines denotes padding in each of the steps.
Current usage metrics show cumulative count of Article Views (full-text article views including HTML views, PDF and ePub downloads, according to the available data) and Abstracts Views on Vision4Press platform.
Data correspond to usage on the plateform after 2015. The current usage metrics is available 48-96 hours after online publication and is updated daily on week days.
Initial download of the metrics may take a while.