Fig. 3
Download original image
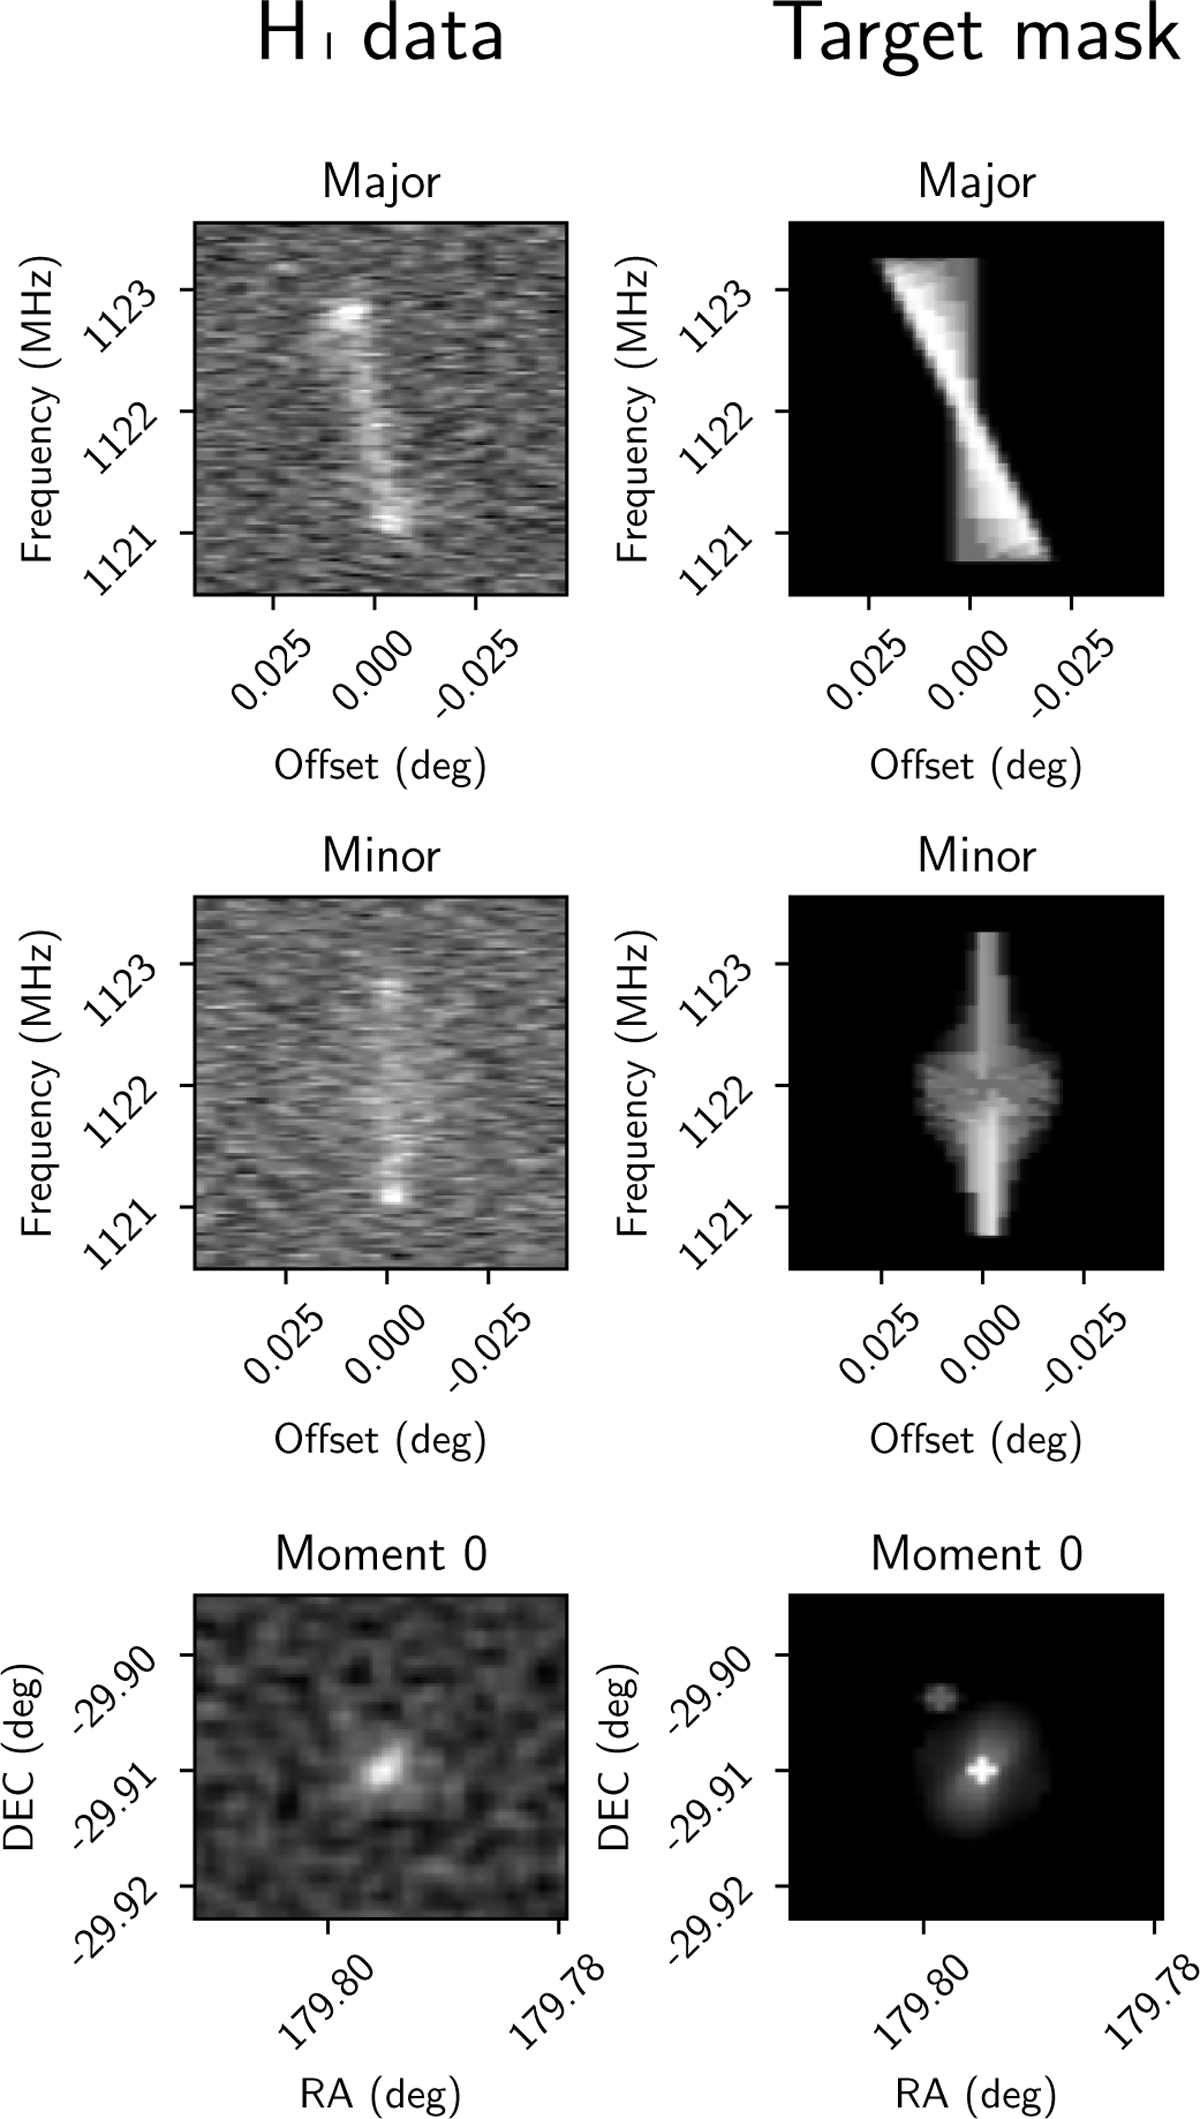
Comparison between data from the H I cube (upper row) and the corresponding target mask (lower row) for a strong source in the development cube. The left column plot shows the intersection along the major axis and the middle column plot shows the minor axis. Gray pixels in the target occur due to rounding when computing slicing the cubic data. The right column plots show an equivalent to Moment 1 plots, that is, all voxel values summed over the frequency range corresponding to the vertical axis in left-hand side plots.
Current usage metrics show cumulative count of Article Views (full-text article views including HTML views, PDF and ePub downloads, according to the available data) and Abstracts Views on Vision4Press platform.
Data correspond to usage on the plateform after 2015. The current usage metrics is available 48-96 hours after online publication and is updated daily on week days.
Initial download of the metrics may take a while.