Fig. 2
Download original image
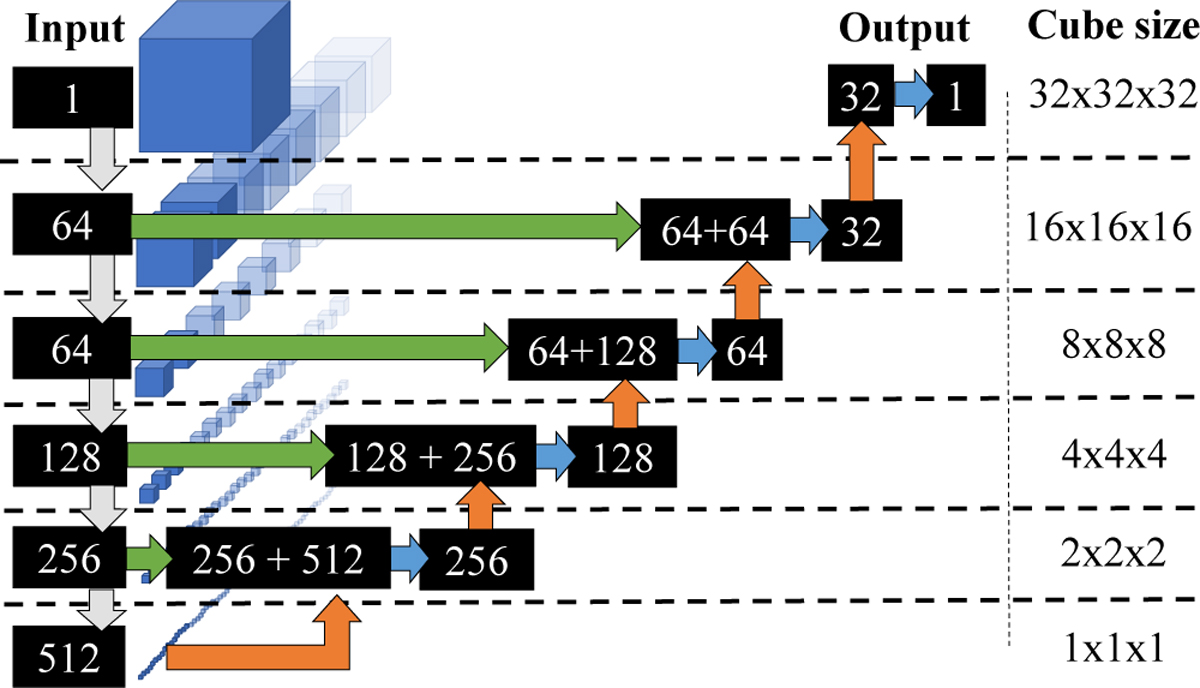
Overview of the used u-net segmentation model for an example input cube of size 32 × 32 × 32. The encoder is formed by all grey vertical arrows pointing downwards on the plot, while the decoder consists of the remaining arrows on the right of the plot. The dashed lines separate the different resolutions, meaning that down- or upsampling actions are used to go between these. Black rectangles with numbers indicate the number of filters of the different stages. Gray arrows represent one or multiple ResNet blocks, each with one downsampling layer. Orange arrows represent upsampling layers, green represents copy and merger actions, and blue arrows represent a sequence of two decoder blocks.
Current usage metrics show cumulative count of Article Views (full-text article views including HTML views, PDF and ePub downloads, according to the available data) and Abstracts Views on Vision4Press platform.
Data correspond to usage on the plateform after 2015. The current usage metrics is available 48-96 hours after online publication and is updated daily on week days.
Initial download of the metrics may take a while.