Fig. A.2.
Download original image
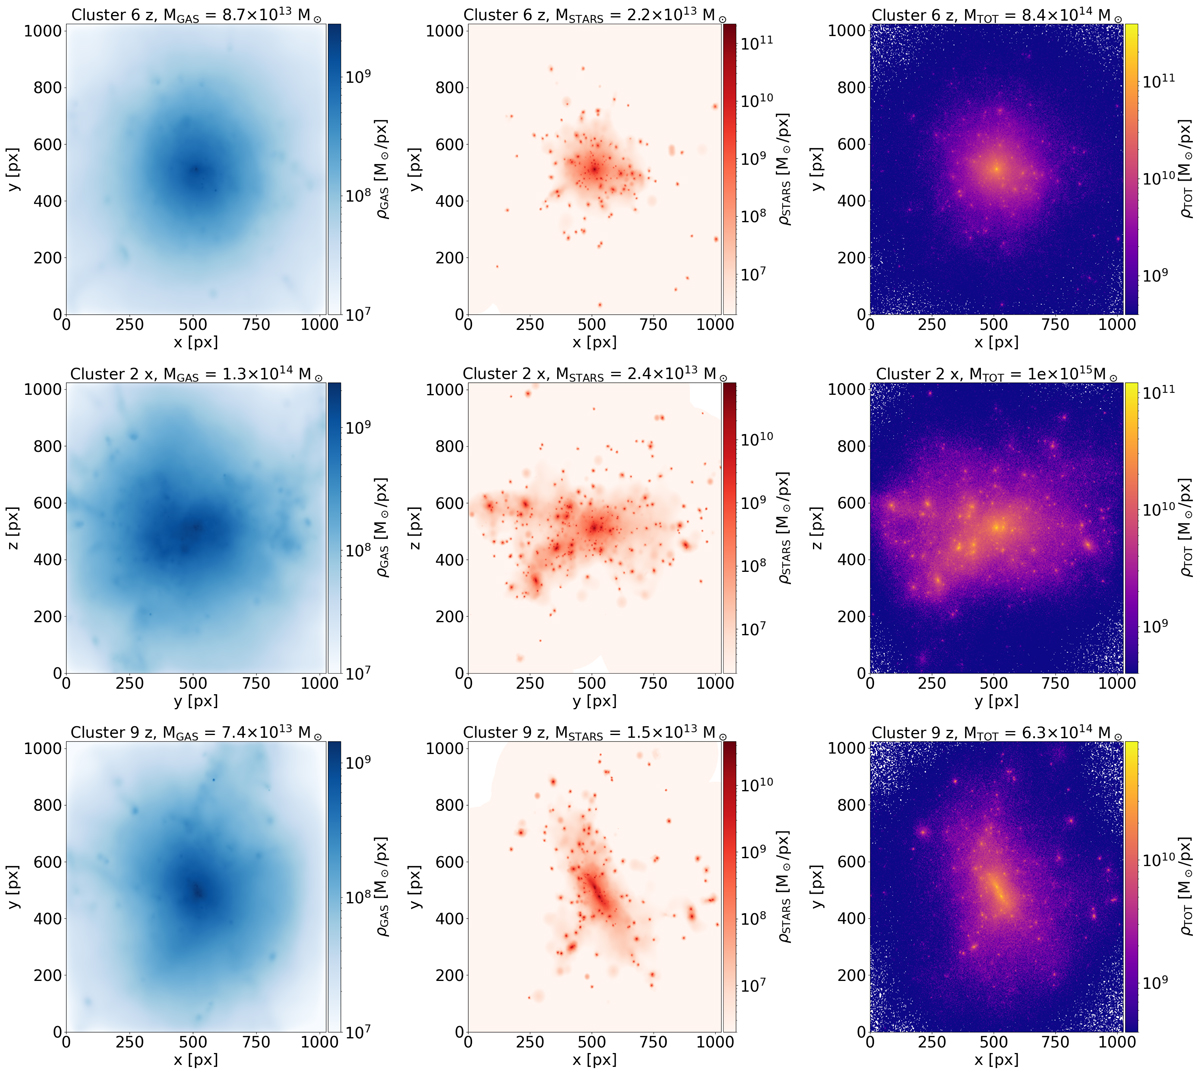
Clusters of galaxies in the Magneticum Box2/hr simulation at z = 0.25. Each row displays one object. Each column shows a different component: the hot gas in the left-hand column, the stars in the middle one, and the total matter distribution in the right-hand one. The panels are 4×R500c large. The side of the maps contains 1024 pixels, so the pixel size is ∼3.9×10⁻³R500c. The figures are color coded according to the density of each component in units of solar masses per pixel. The first and third clusters are projected along the z axis, the middle one along the x axis. The mass of each component inside R500c is reported in the title of each panel.
Current usage metrics show cumulative count of Article Views (full-text article views including HTML views, PDF and ePub downloads, according to the available data) and Abstracts Views on Vision4Press platform.
Data correspond to usage on the plateform after 2015. The current usage metrics is available 48-96 hours after online publication and is updated daily on week days.
Initial download of the metrics may take a while.