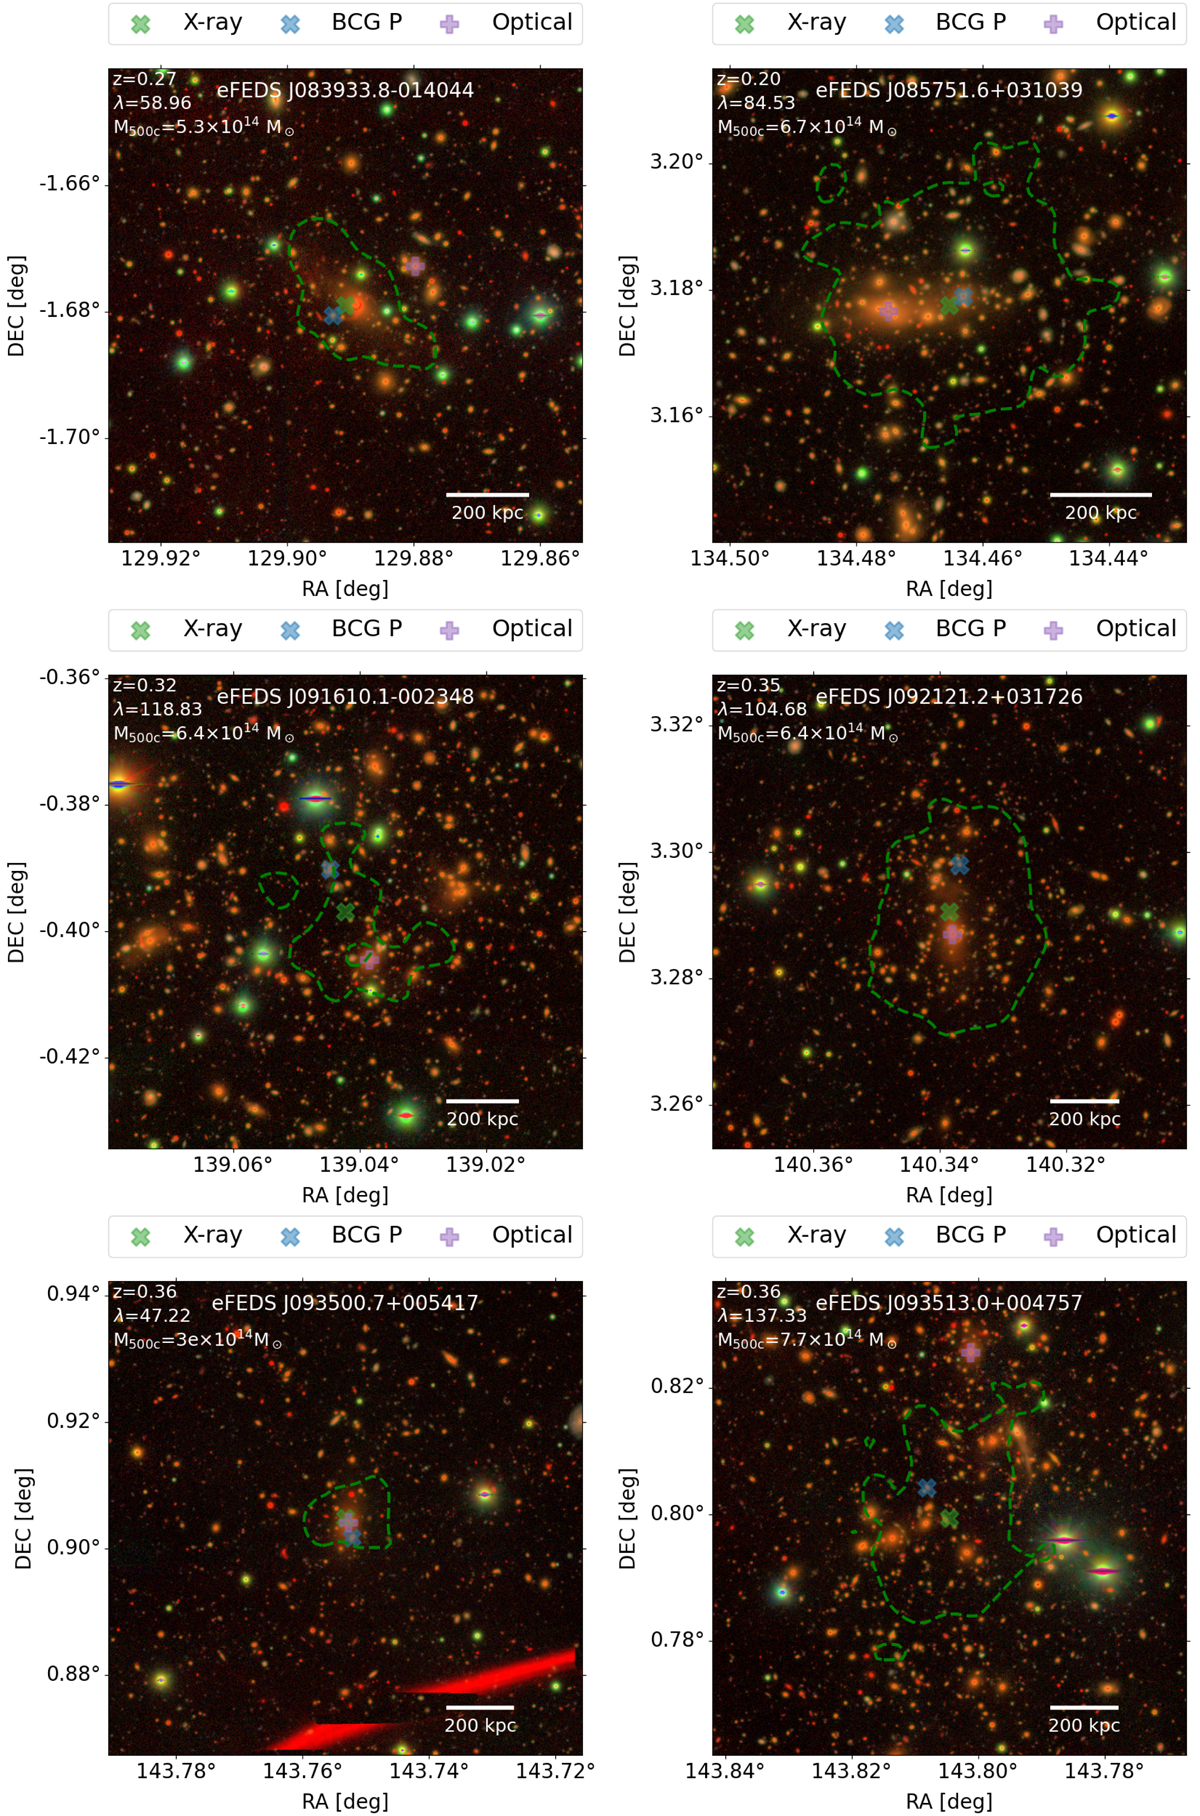
Fig. A.1.
Download original image
eFEDS clusters. Each panel shows a different cluster with the relative name, redshift (z), richness (λ), and mass (M500c). The optical image is an RGB cube built from HSC data using the g, r, and z bands. The green lines denote the 3σ contours of the X-ray emission. The green cross identifies the X-ray center found by eSASS, the blue one denotes the position of the galaxy with the largest membership probability, and the pink plus sign locates the optical center identified the centering algorithm of redMaPPer.
Current usage metrics show cumulative count of Article Views (full-text article views including HTML views, PDF and ePub downloads, according to the available data) and Abstracts Views on Vision4Press platform.
Data correspond to usage on the plateform after 2015. The current usage metrics is available 48-96 hours after online publication and is updated daily on week days.
Initial download of the metrics may take a while.