Fig. 5.
Download original image
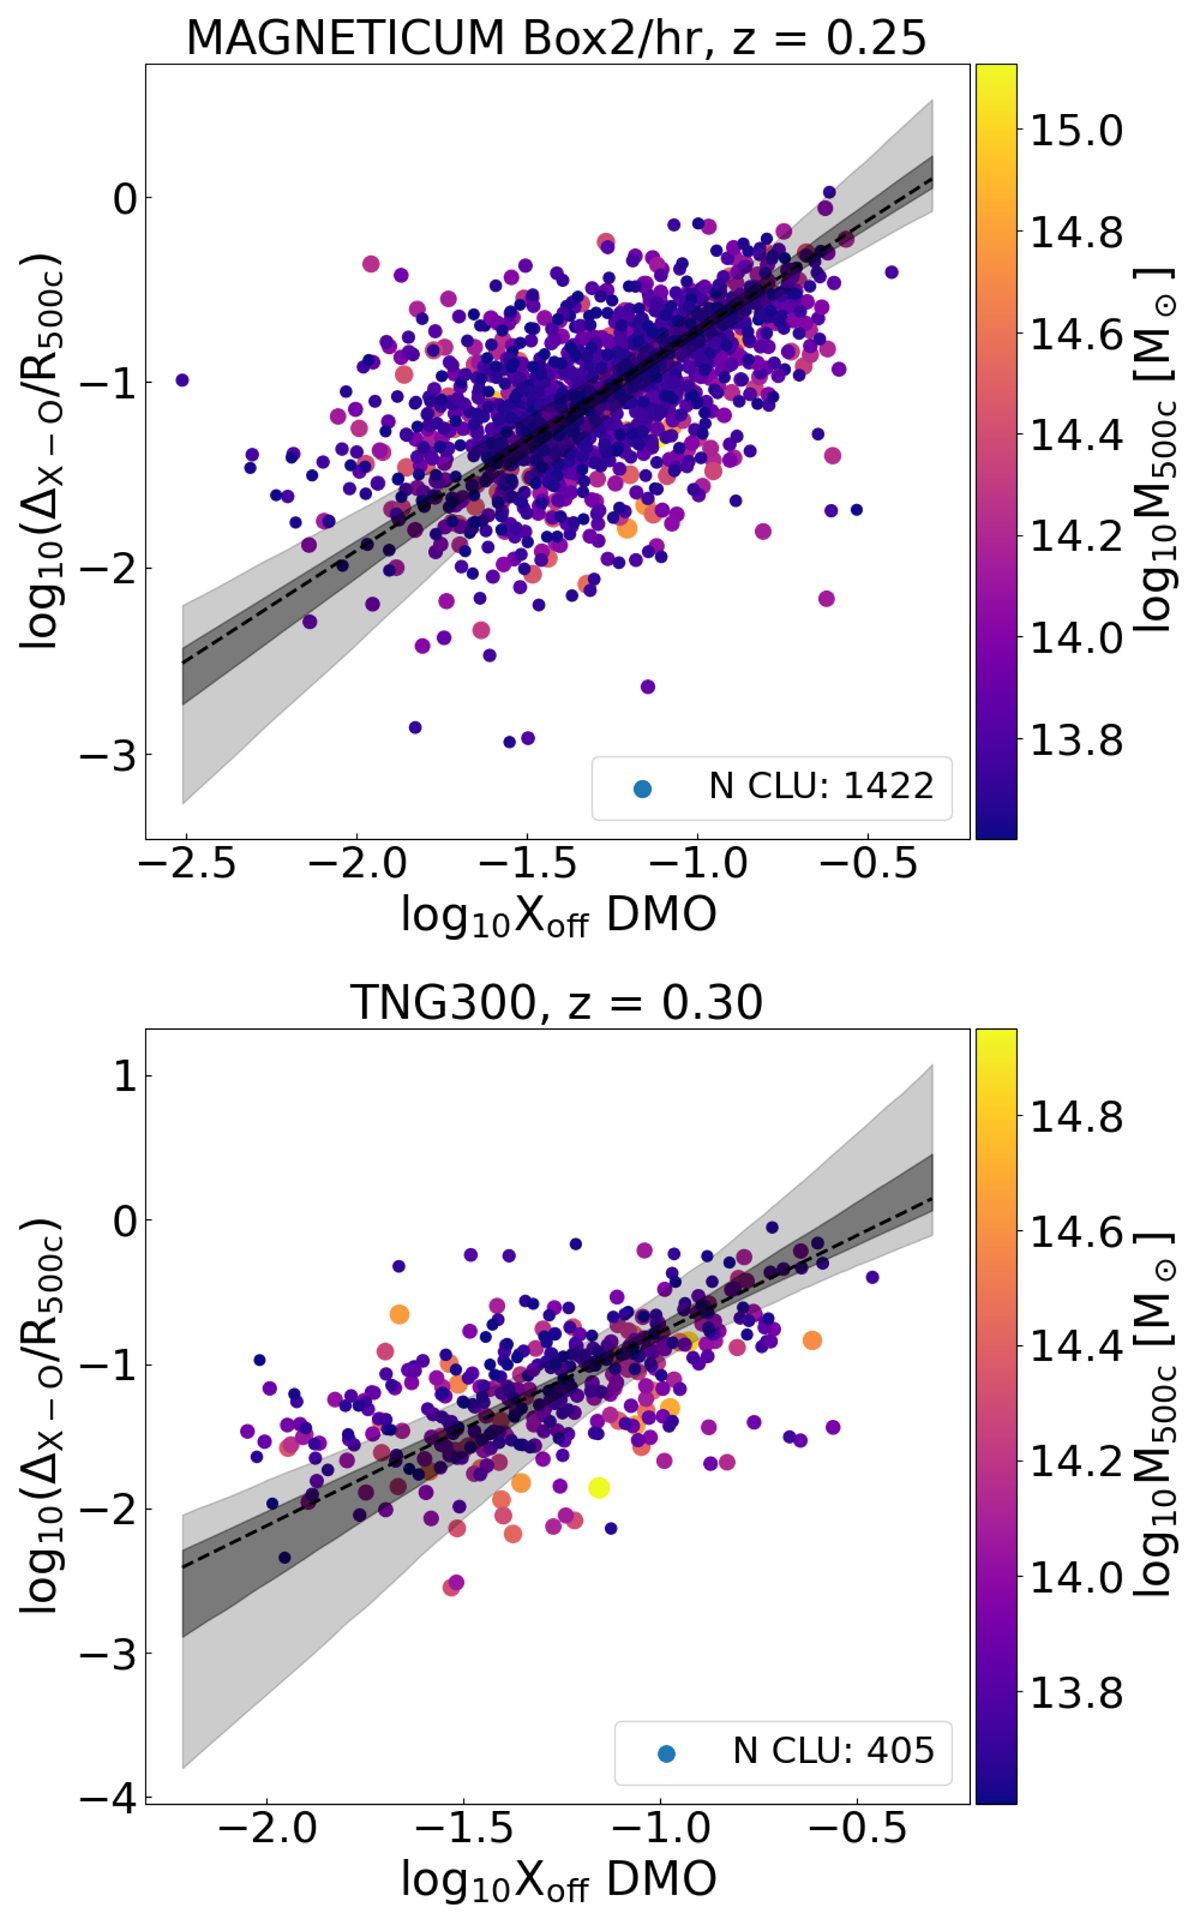
Relation between the displacement ΔX − O and the offset parameter Xoff. The upper panel shows the Magneticum Box2/hr simulation, the bottom panel refers to TNG300. Each dot denotes a halo. The dots are color-coded as a function of mass. The black dashed line shows the best-fit model, the black shaded areas denote the 1σ and 2σ uncertainty on the model.
Current usage metrics show cumulative count of Article Views (full-text article views including HTML views, PDF and ePub downloads, according to the available data) and Abstracts Views on Vision4Press platform.
Data correspond to usage on the plateform after 2015. The current usage metrics is available 48-96 hours after online publication and is updated daily on week days.
Initial download of the metrics may take a while.