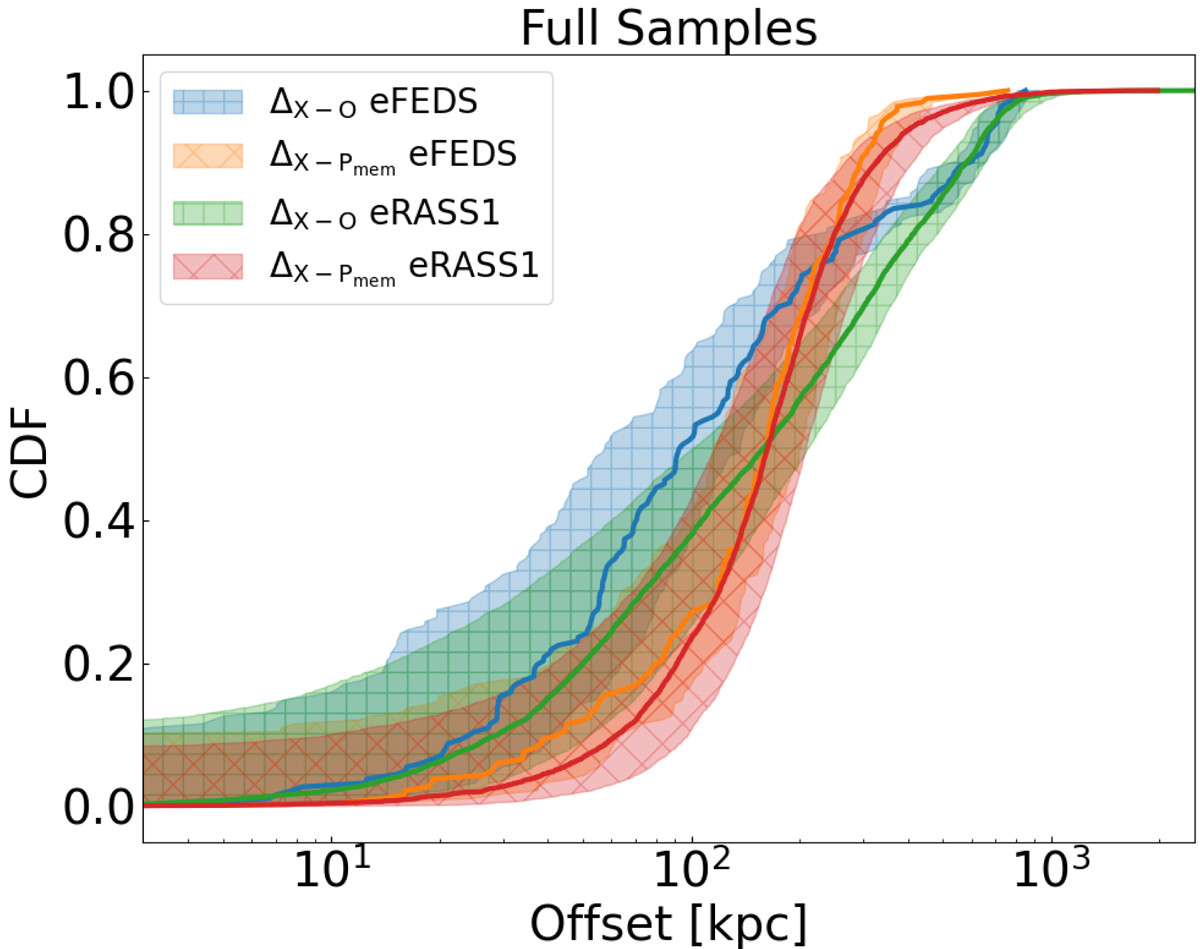
Fig. 2.
Download original image
Cumulative distribution functions of the offsets between X-ray and optical centers for eROSITA clusters between redshift 0.15 and 0.8, more than 20 counts, and richness λ > 20. These cuts yield 182 (4568) clusters from eFEDS (eRASS1). The shaded areas denote the uncertainty on the distributions. Different colors denote distinct definitions of the optical center: the one identified by the redMaPPer centering algorithm and the position of the galaxy with the largest membership probability (blue and orange for eFEDS, green and red for eRASS1).
Current usage metrics show cumulative count of Article Views (full-text article views including HTML views, PDF and ePub downloads, according to the available data) and Abstracts Views on Vision4Press platform.
Data correspond to usage on the plateform after 2015. The current usage metrics is available 48-96 hours after online publication and is updated daily on week days.
Initial download of the metrics may take a while.