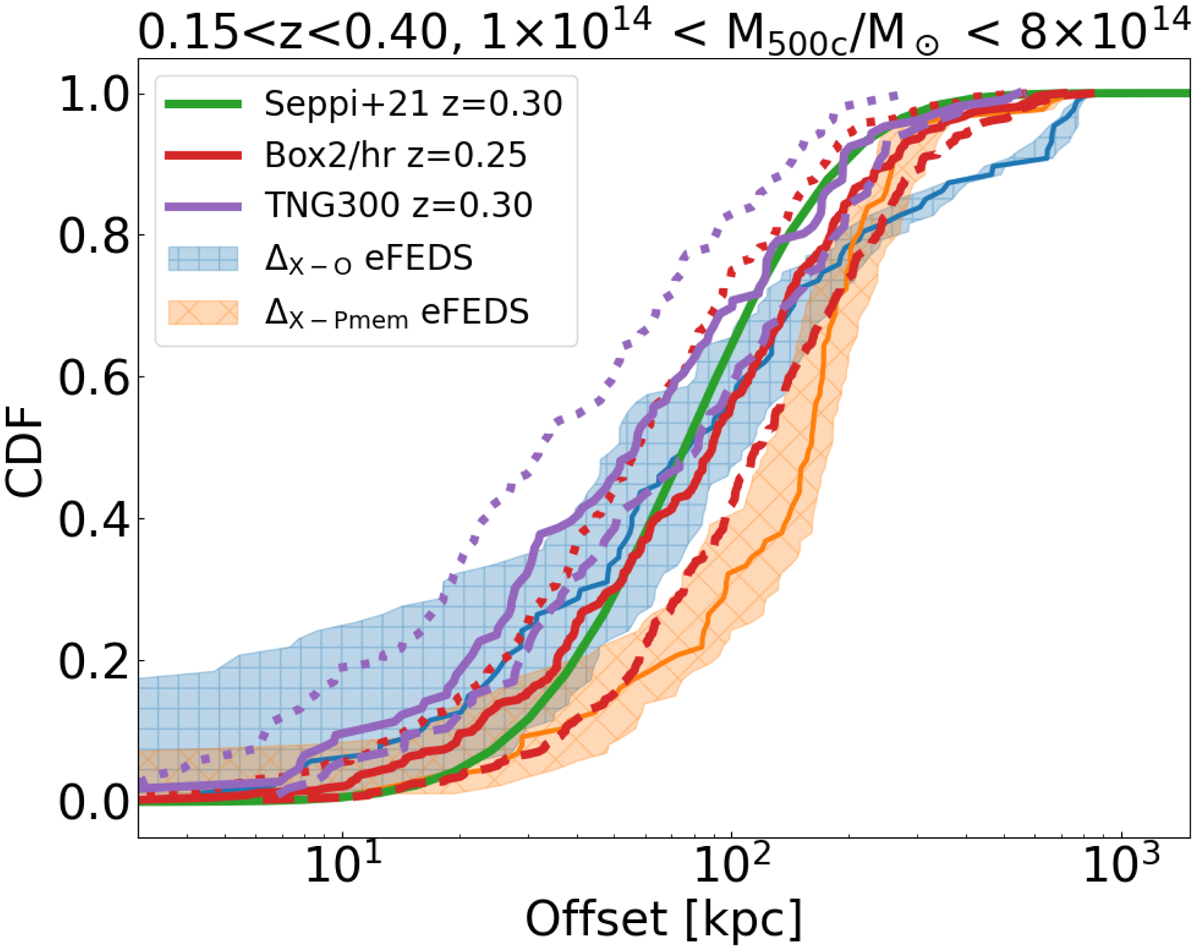
Fig. 1.
Download original image
Comparison between the offsets measured in eROSITA, the prediction of the theoretical model, and hydrodynamical simulations. The cumulative distribution functions of the offsets between X-ray and optical centers for eFEDS clusters between redshift 0.15 and 0.4, and mass between 1×10¹⁴ and 8×10¹⁴ M⊙ are denoted by the blue and orange lines. The first one refers to the optical center identified by the redMaPPer centering algorithm, the latter to the position of the galaxy with the largest membership probabilities. The shaded areas identify the uncertainty on the distributions. The green line shows the prediction obtained from the Seppi et al. (2021) model described in Sect. 3.2. The red (violet) one denotes the CDF of the offsets between the gas center and the CG position in the Magneticum (TNG) simulation described in Sect. 3.3. The corresponding dashed and dotted lines account for the maximum and minimum projection effects. There is a broad agreement between the data, the prediction of the simulations, and the N-body model. However, the tails of the distributions are different. The N-body model predicts larger (smaller) displacements compared to data and hydrodynamical simulations at the low (high) offset end.
Current usage metrics show cumulative count of Article Views (full-text article views including HTML views, PDF and ePub downloads, according to the available data) and Abstracts Views on Vision4Press platform.
Data correspond to usage on the plateform after 2015. The current usage metrics is available 48-96 hours after online publication and is updated daily on week days.
Initial download of the metrics may take a while.