Fig. 4
Download original image
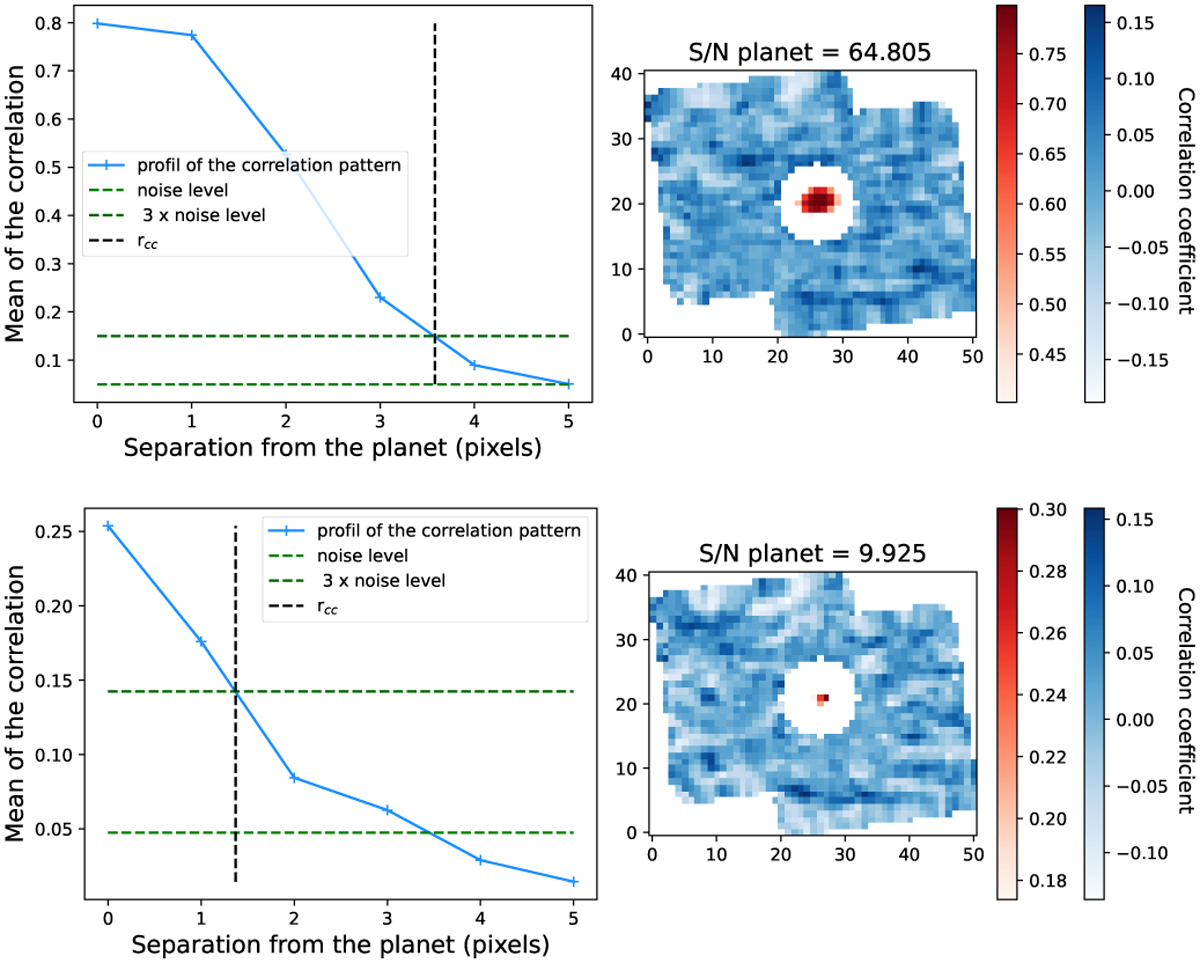
Mean azimuthal profile of the correlation pattern (left) and typical correlation map to illustrate the S/N measurement (right), the same configuration as in Fig. 1. The pixels used to evaluate the noise as the standard deviation of the distribution are shown in blue. The pixels that are considered for the signal of the planet, as defined in Sect. 3.3, are shown in red. Top: simulation with a low noise level (example with a star at 1.8′′ from the planet). Bottom: simulation with a higher noise level (example with a star at 0.6′′ from the planet).
Current usage metrics show cumulative count of Article Views (full-text article views including HTML views, PDF and ePub downloads, according to the available data) and Abstracts Views on Vision4Press platform.
Data correspond to usage on the plateform after 2015. The current usage metrics is available 48-96 hours after online publication and is updated daily on week days.
Initial download of the metrics may take a while.