Open Access
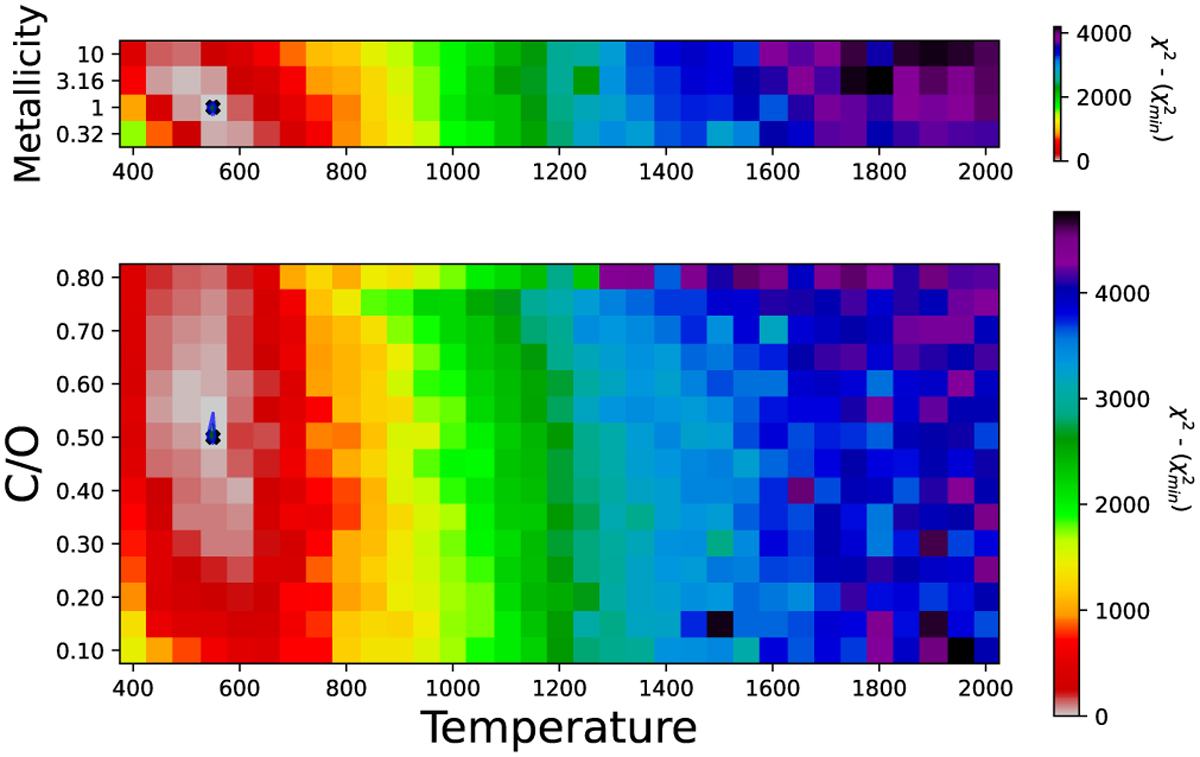
Fig. 14
Download original image
Values ![]() using the high-frequency spectrum and a grid of Exo-REM models. The log of the surface gravity is fixed at 4.0 to correspond to the input value in each subplot. Green, blue, and black lines are respectively 1σ, 2σ, and 3σ confidence regions (2.3, 6.18, and 11.8).
using the high-frequency spectrum and a grid of Exo-REM models. The log of the surface gravity is fixed at 4.0 to correspond to the input value in each subplot. Green, blue, and black lines are respectively 1σ, 2σ, and 3σ confidence regions (2.3, 6.18, and 11.8).
Current usage metrics show cumulative count of Article Views (full-text article views including HTML views, PDF and ePub downloads, according to the available data) and Abstracts Views on Vision4Press platform.
Data correspond to usage on the plateform after 2015. The current usage metrics is available 48-96 hours after online publication and is updated daily on week days.
Initial download of the metrics may take a while.