Fig. 1
Download original image
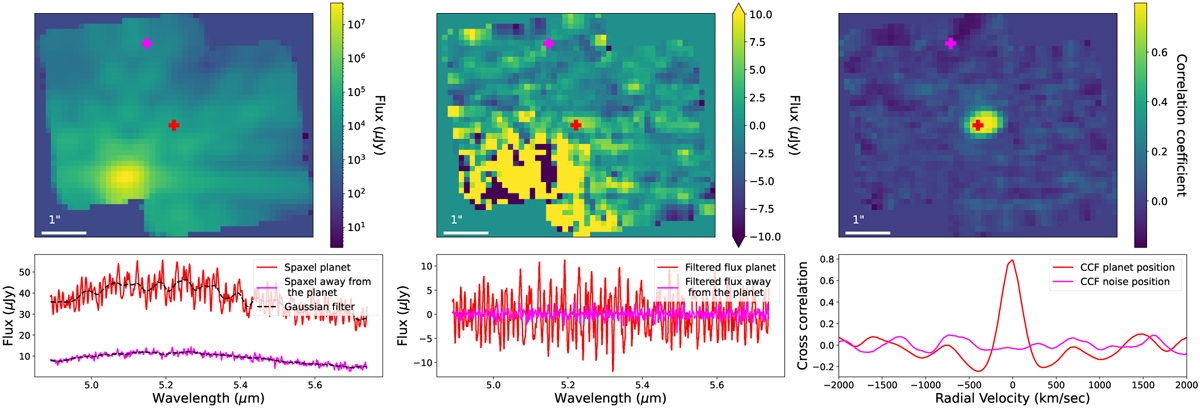
Top: Simulation in channel 1A for a star (T = 6000 K) and a planet (T = 1000 K) separated by 1.8′′. From left to right: direct image resulting from four dithered positions, the star being offset in the bottom left corner (sum over the wavelengths of the channel); high frequencies residuals after subtracting the spectral Gaussian filter in each spaxel; correlation map with the very same template spectra as injected into the simulation for δV = 0. The red cross indicates the position of the planet, and the pink cross is the arbitrary position chosen away from the planet. Bottom: illustration of the molecular mapping technique in two spaxels, one at the position of the planet (red) and the other one at a position away from the planet (pink), for channel 1A (4.885–5.751 µm). From left to right: we display the filtering process applied to the model, the combined spectra and the Gaussian filter (black) in the two spaxels (pink and red), the high-frequency component after subtraction, and the cross-correlation function for δV= [−2000; +2000] km s−1.
Current usage metrics show cumulative count of Article Views (full-text article views including HTML views, PDF and ePub downloads, according to the available data) and Abstracts Views on Vision4Press platform.
Data correspond to usage on the plateform after 2015. The current usage metrics is available 48-96 hours after online publication and is updated daily on week days.
Initial download of the metrics may take a while.