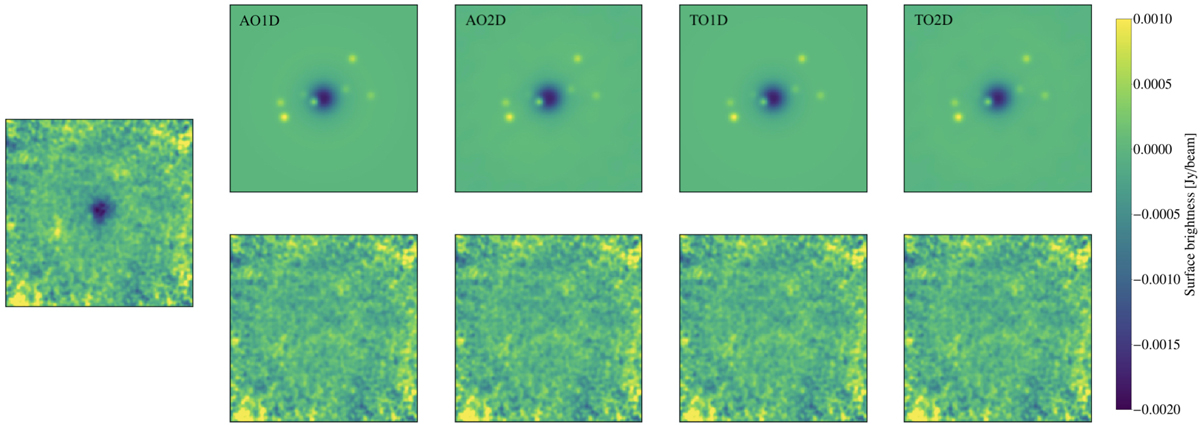
Fig. 5.
Download original image
150 GHz maps of CL J1226.9+3332. Left: NIKA2 150 GHz surface brightness map of CL J1226.9+3332. Top: best-fit models of the tSZ signal and point sources. Bottom: residual maps, difference between the data map and each best-fit model. Results obtained with different transfer function and noise estimates (from left to right): AO1D, AO2D, TO1D, and TO2D. All maps have been smoothed with a 10′ Gaussian kernel for display purposes and are shown in units of Jy beam−1.
Current usage metrics show cumulative count of Article Views (full-text article views including HTML views, PDF and ePub downloads, according to the available data) and Abstracts Views on Vision4Press platform.
Data correspond to usage on the plateform after 2015. The current usage metrics is available 48-96 hours after online publication and is updated daily on week days.
Initial download of the metrics may take a while.