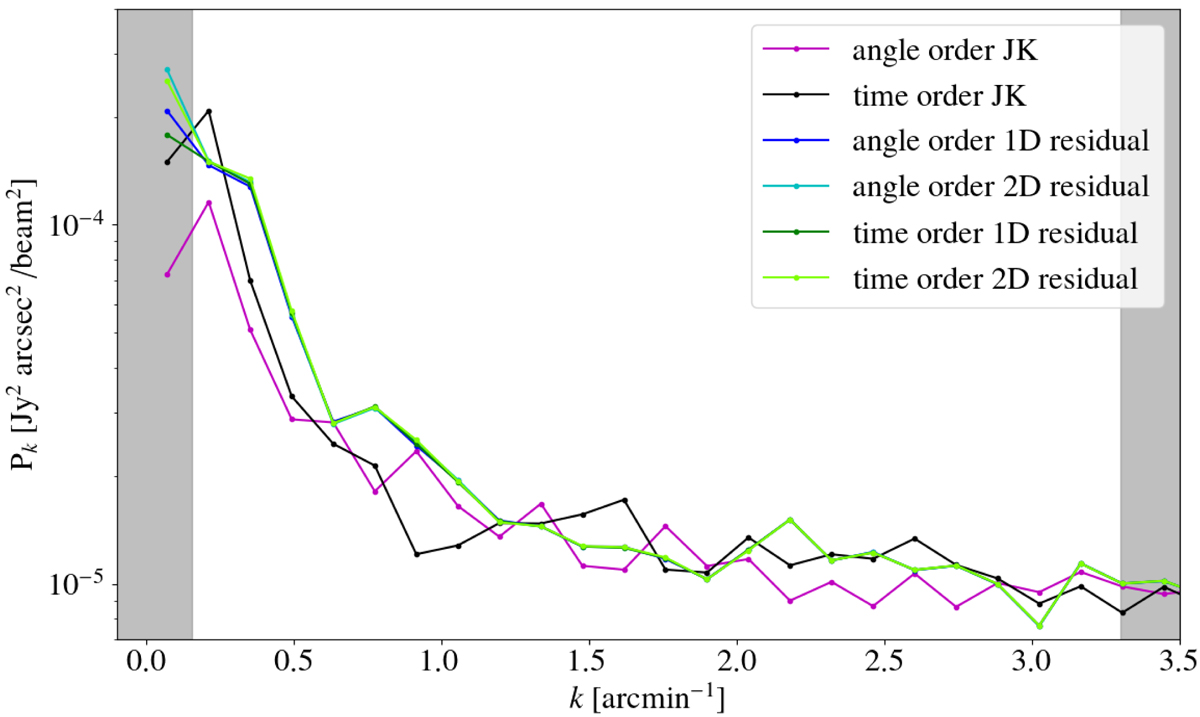
Fig. 3.
Download original image
Power spectra of noise map estimates for NIKA2 150 GHz data. The spectra for the JK maps estimated with angle ordered and time ordered scans are in pink and black, respectively. The power spectra of the different residual maps for the best-fit models shown in Fig. 5 are in blue and green. The grey regions represent the NIKA2 instrumental limits given by the field of view (for small angular frequencies) and the beam FWHM (for large angular frequencies).
Current usage metrics show cumulative count of Article Views (full-text article views including HTML views, PDF and ePub downloads, according to the available data) and Abstracts Views on Vision4Press platform.
Data correspond to usage on the plateform after 2015. The current usage metrics is available 48-96 hours after online publication and is updated daily on week days.
Initial download of the metrics may take a while.