Fig. 2.
Download original image
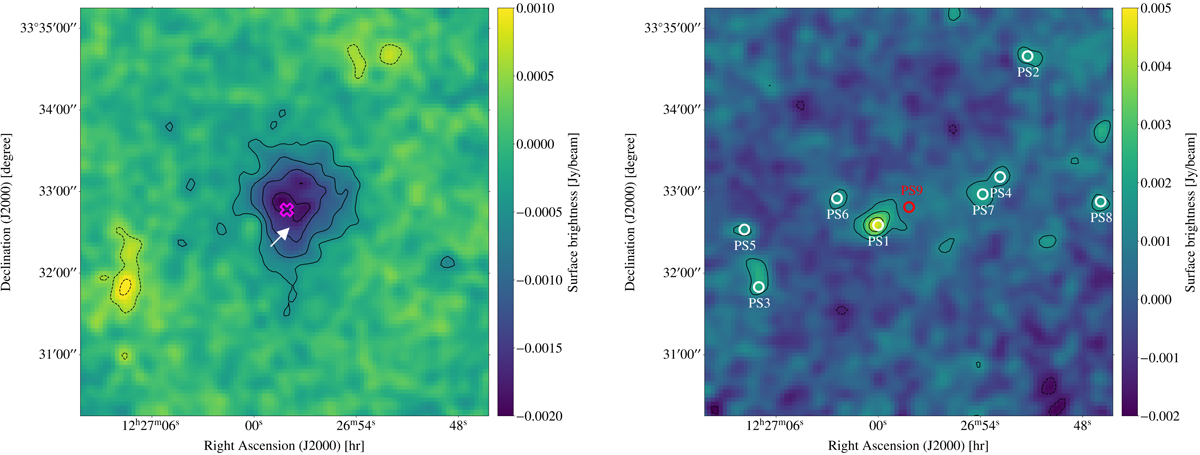
NIKA2 maps of CL J1226.9+3332 at 150 GHz (left) and 260 GHz (right) in Jy beam−1 units. Contours show S/N levels in multiples of ±3σ. Both maps have been smoothed with a 10′ FWHM Gaussian kernel. The position of the X-ray centre is shown as a magenta cross in the 150 GHz map and the elongation of the tSZ signal towards the south-west is indicated by the white arrow. White and red circles in the 260 GHz map show the submillimetre and radio point sources, respectively.
Current usage metrics show cumulative count of Article Views (full-text article views including HTML views, PDF and ePub downloads, according to the available data) and Abstracts Views on Vision4Press platform.
Data correspond to usage on the plateform after 2015. The current usage metrics is available 48-96 hours after online publication and is updated daily on week days.
Initial download of the metrics may take a while.