Fig. 15.
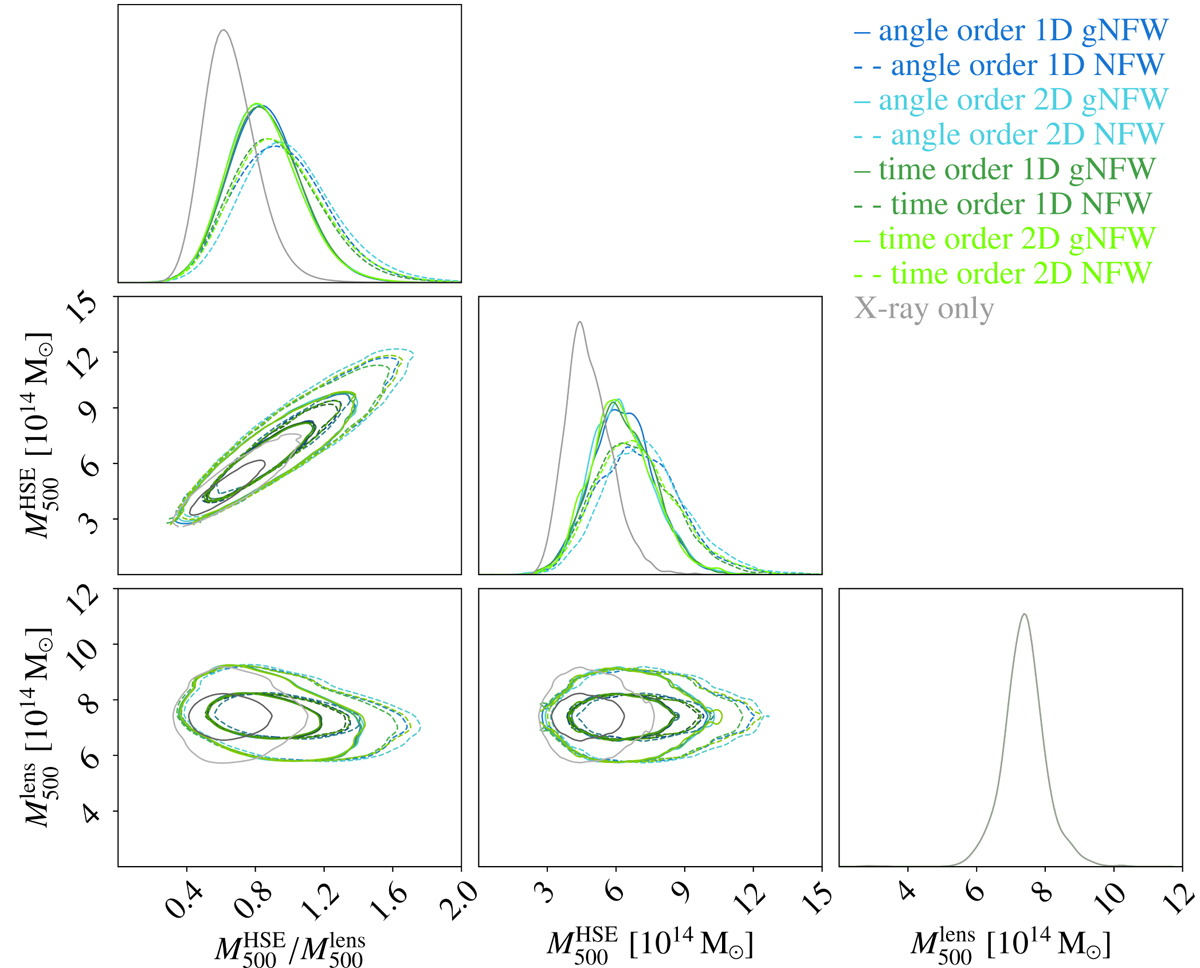
Download original image
HSE mass estimates with respect to lensing estimates at R500. Blue and green solid lines correspond to the HSE masses obtained from the gNFW pressure model fit and dashed lines to the NFW method. The grey line corresponds to the HSE mass obtained with XMM-Newton-only data. We present the 1σ and 2σ contours. The lensing mass distribution is the combination of the results for the PIEMD+eNFW and LTM analyses.
Current usage metrics show cumulative count of Article Views (full-text article views including HTML views, PDF and ePub downloads, according to the available data) and Abstracts Views on Vision4Press platform.
Data correspond to usage on the plateform after 2015. The current usage metrics is available 48-96 hours after online publication and is updated daily on week days.
Initial download of the metrics may take a while.