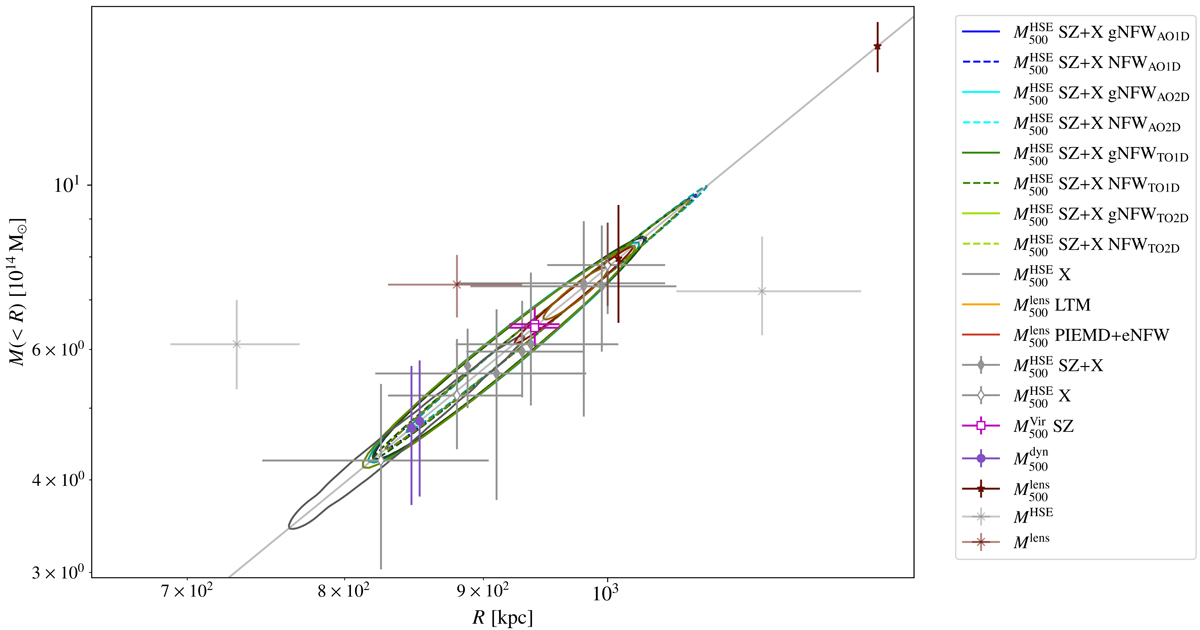
Fig. 14.

Download original image
R − M(< R) plane summarising the R500 − M500 results for CL J1226.9+3332. In the case of the HSE mass estimates the blue and green 1σ contours show the results obtained in this work combining tSZ and X-ray data for the four NIKA2 analyses. The solid and dashed lines are for the gNFW pressure and the NFW density models, respectively. The grey contour corresponds to the HSE mass estimate for the XMM-Newton-only data. In the case of literature data the filled (empty) grey diamonds represent HSE masses from the combination of tSZ and X-ray data (X-ray-only results). The red and orange contours correspond to the lensing mass estimates obtained from the CLASH LTM and PIEMD+eNFW convergence maps in this work, respectively. Pink squares show the tSZ-only mass assuming virial relation, purple circles are dynamical mass estimates, and brown stars the lensing estimates. Grey and brown crosses show HSE and lensing masses from the literature close to M500. The diagonal bright grey line defines the R500 − M500 relation. Slight deviations from this line are due to differences in the cosmological model used in each work.
Current usage metrics show cumulative count of Article Views (full-text article views including HTML views, PDF and ePub downloads, according to the available data) and Abstracts Views on Vision4Press platform.
Data correspond to usage on the plateform after 2015. The current usage metrics is available 48-96 hours after online publication and is updated daily on week days.
Initial download of the metrics may take a while.


