Open Access
Fig. 12.
Download original image
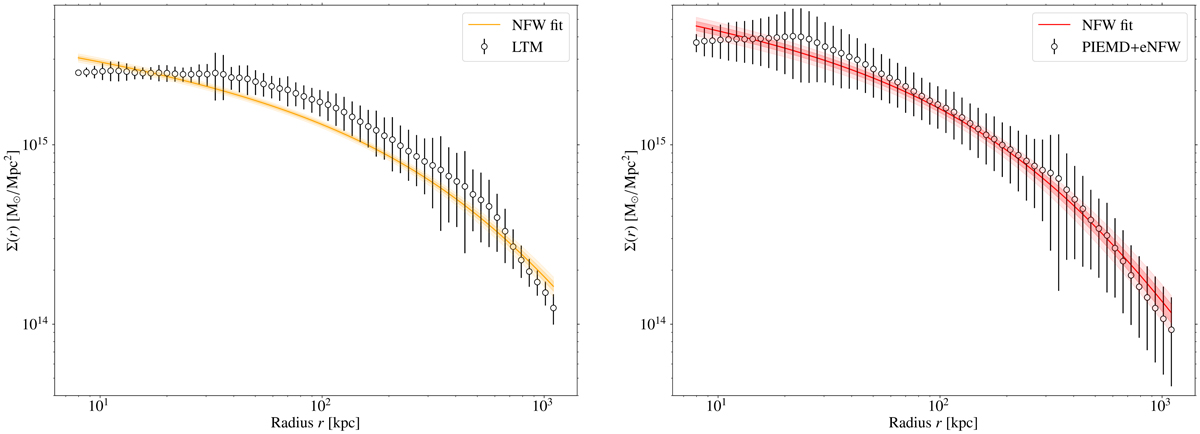
Projected mass density profiles obtained from CLASH convergence maps for the LTM (left) and PIEMD+eNFW (right) models. We also show the best-fit NFW model (orange and red lines) and the 2.5th, 16th, 84th and 97.5th percentiles (shaded area).
Current usage metrics show cumulative count of Article Views (full-text article views including HTML views, PDF and ePub downloads, according to the available data) and Abstracts Views on Vision4Press platform.
Data correspond to usage on the plateform after 2015. The current usage metrics is available 48-96 hours after online publication and is updated daily on week days.
Initial download of the metrics may take a while.