Open Access
Fig. 11.
Download original image
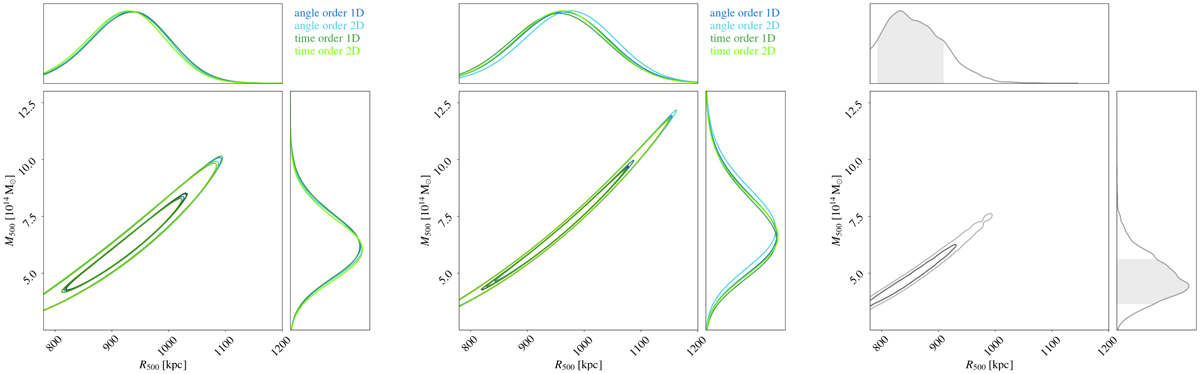
Probability distributions (1D and 2D) for ![]() and
and ![]() from the gNFW (left) and NFW (centre) models in the combined XMM-Newton and NIKA2 and R18 data, and from the XMM-Newton X-ray-only data (right). The different blue and green lines correspond to results for the four NIKA2 test cases considered.
from the gNFW (left) and NFW (centre) models in the combined XMM-Newton and NIKA2 and R18 data, and from the XMM-Newton X-ray-only data (right). The different blue and green lines correspond to results for the four NIKA2 test cases considered.
Current usage metrics show cumulative count of Article Views (full-text article views including HTML views, PDF and ePub downloads, according to the available data) and Abstracts Views on Vision4Press platform.
Data correspond to usage on the plateform after 2015. The current usage metrics is available 48-96 hours after online publication and is updated daily on week days.
Initial download of the metrics may take a while.