Fig. 10.
Download original image
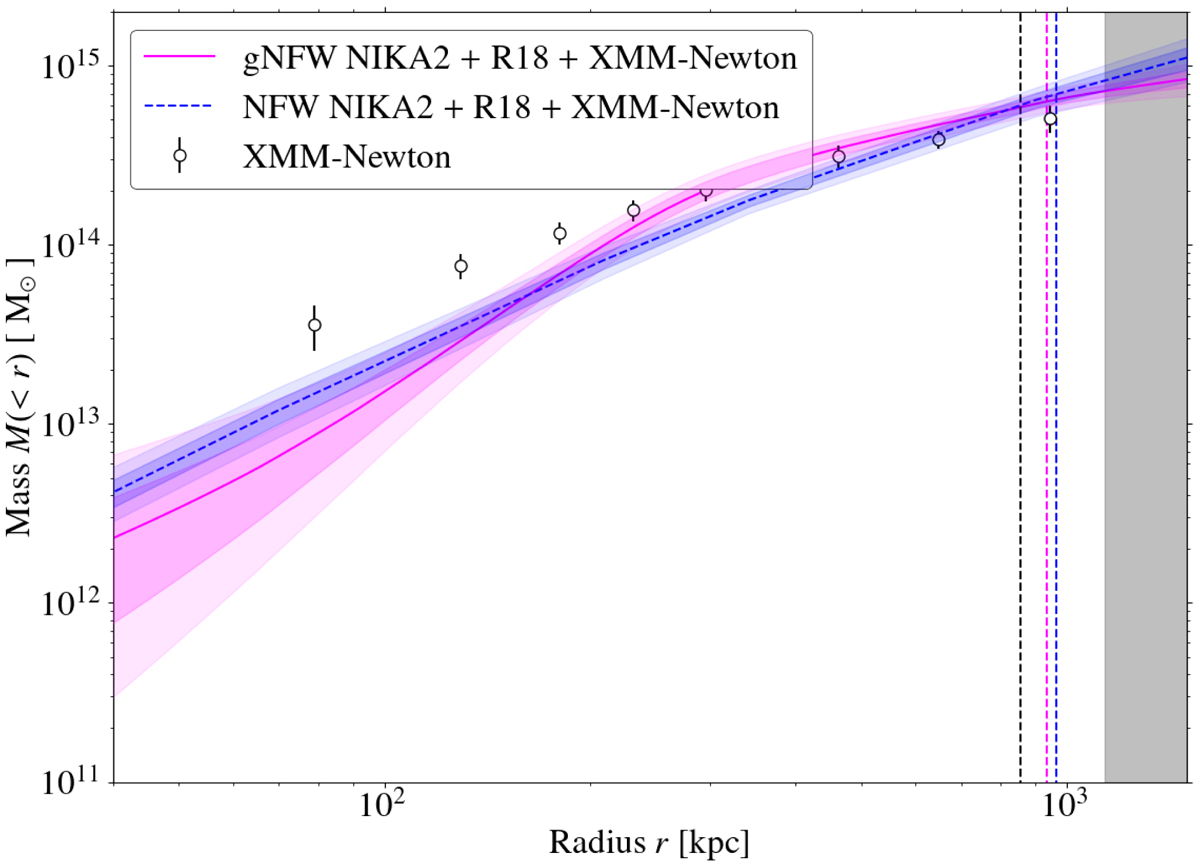
HSE mass profile estimates for CL J1226.9+3332 obtained with NIKA2 (angle order 1D) and R18 tSZ data combined with the XMM-Newton electron density profile. The solid magenta and dashed blue lines correspond to the gNFW and NFW methods, respectively. The shaded areas show the 2.5th, 16th, 84th, and 97.5th percentiles. Empty dots correspond to the HSE mass profile obtained from XMM-Newton-only data. Vertical dashed lines show the ![]() obtained from each mass profile. The grey region represents the radial ranges at which the profiles are extrapolated.
obtained from each mass profile. The grey region represents the radial ranges at which the profiles are extrapolated.
Current usage metrics show cumulative count of Article Views (full-text article views including HTML views, PDF and ePub downloads, according to the available data) and Abstracts Views on Vision4Press platform.
Data correspond to usage on the plateform after 2015. The current usage metrics is available 48-96 hours after online publication and is updated daily on week days.
Initial download of the metrics may take a while.