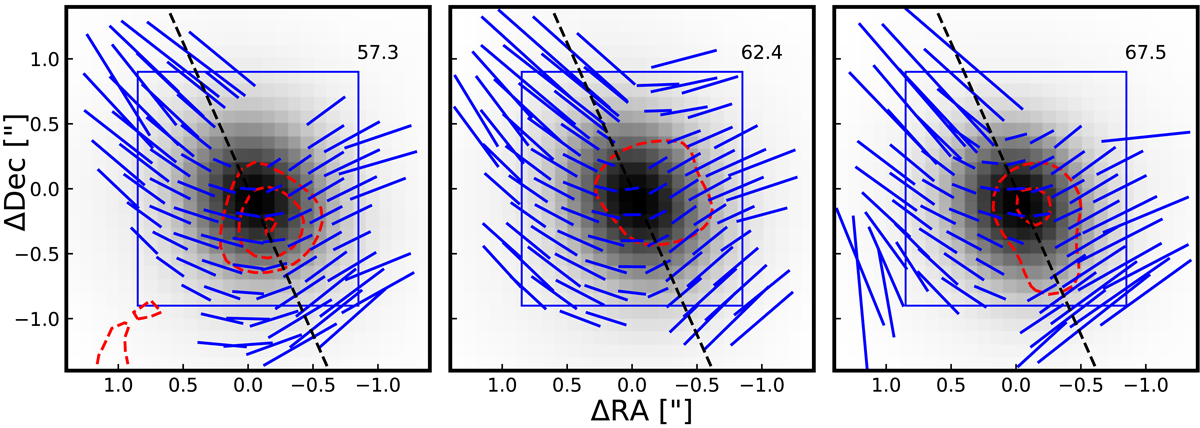
Fig. 4.
Download original image
Zoomed-in view of central region of CO J = 2 − 1 emission previously shown in Fig. 2. The greyscale indicates the Stokes I emission and the blue line segments indicate the linearly polarisation direction. The red dashed contours represent the (negative) Stokes V emission at −8, −6, and −4σ, where σ = 0.4 mJy beam−1. The outflow direction is indicated by the dashed line. The blue box indicates the region of the 1612 MHz OH masers for which a linear polarisation map is presented in B03 (their Fig. 7). The majority of the OH masers are located within ∼0.4″ of the centre of the map. The channel velocity in km s−1 is given the top right corner of each panel.
Current usage metrics show cumulative count of Article Views (full-text article views including HTML views, PDF and ePub downloads, according to the available data) and Abstracts Views on Vision4Press platform.
Data correspond to usage on the plateform after 2015. The current usage metrics is available 48-96 hours after online publication and is updated daily on week days.
Initial download of the metrics may take a while.