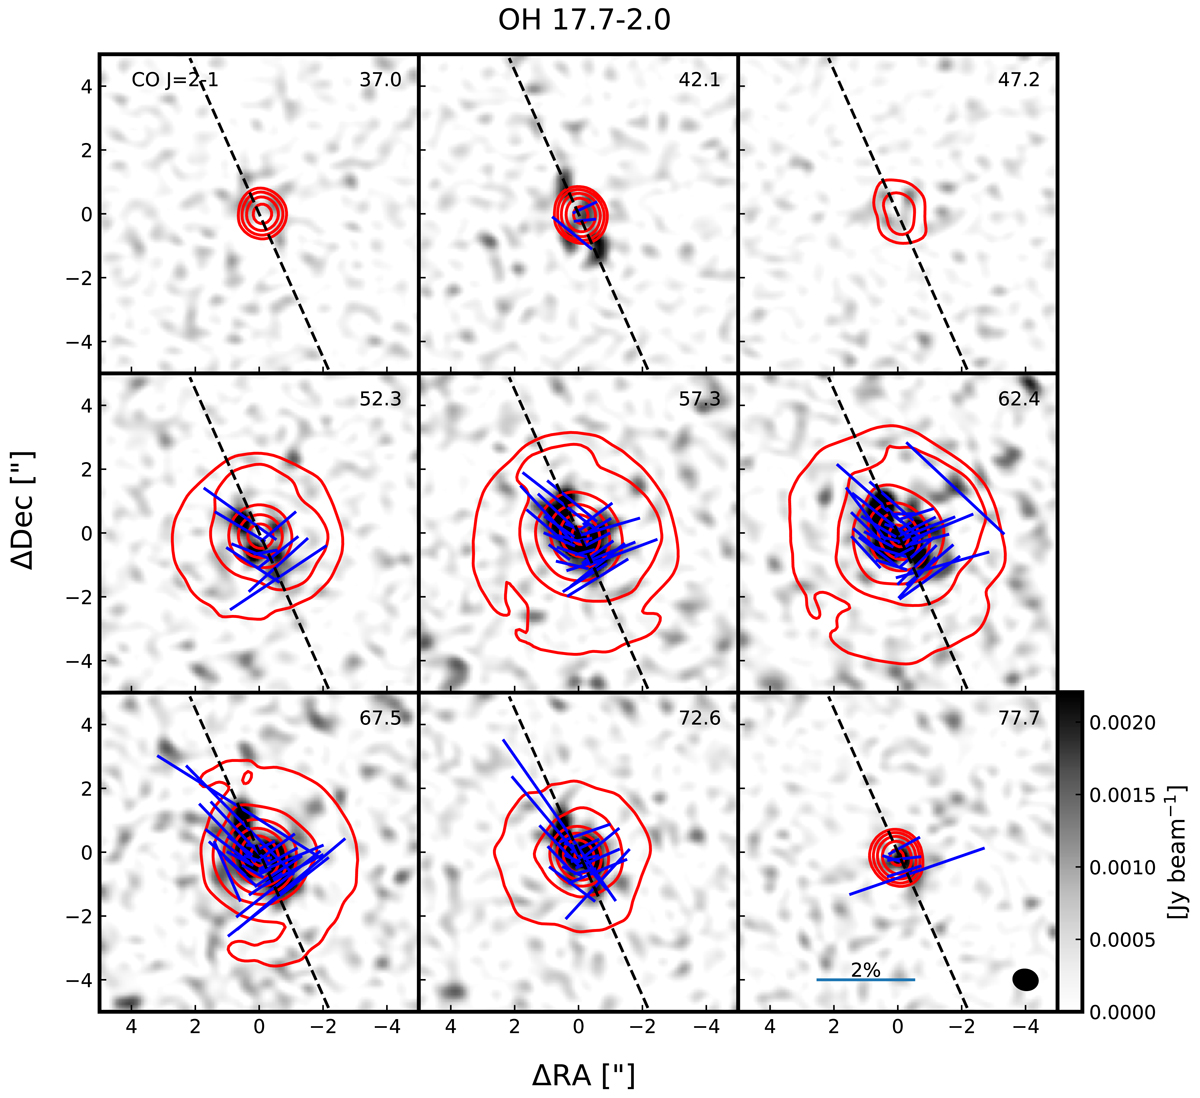
Fig. 2.
Download original image
Channel maps of polarised CO J = 2 − 1 emission around the post-AGB star OH 17.7−2.0. The Stokes I total intensity emission is indicated by the solid red contours at 2.5, 5, 10, 20, 40, and 80% of the peak emission (ICO, peak = 1.04 Jy beam−1). The linearly polarised emission is shown as a greyscale map, and the blue line segments denote the linear polarisation direction when the polarised emission > 5σP. The uncertainty on the polarisation direction is thus ≲7°. The segments are scaled to the level of fractional polarisation with the scale indicated in the bottom left panel. The maximum polarisation Pl, max = 4.1%. The panels are labelled with the VLSR velocity in km s−1, and the beam size is shown in the bottom right panel. The stellar velocity VLSR, * = 62.0 km s−1. The dashed line indicates the direction of the outflow of OH 17.7−2.0, as in Fig. 1.
Current usage metrics show cumulative count of Article Views (full-text article views including HTML views, PDF and ePub downloads, according to the available data) and Abstracts Views on Vision4Press platform.
Data correspond to usage on the plateform after 2015. The current usage metrics is available 48-96 hours after online publication and is updated daily on week days.
Initial download of the metrics may take a while.