Fig. 1.
Download original image
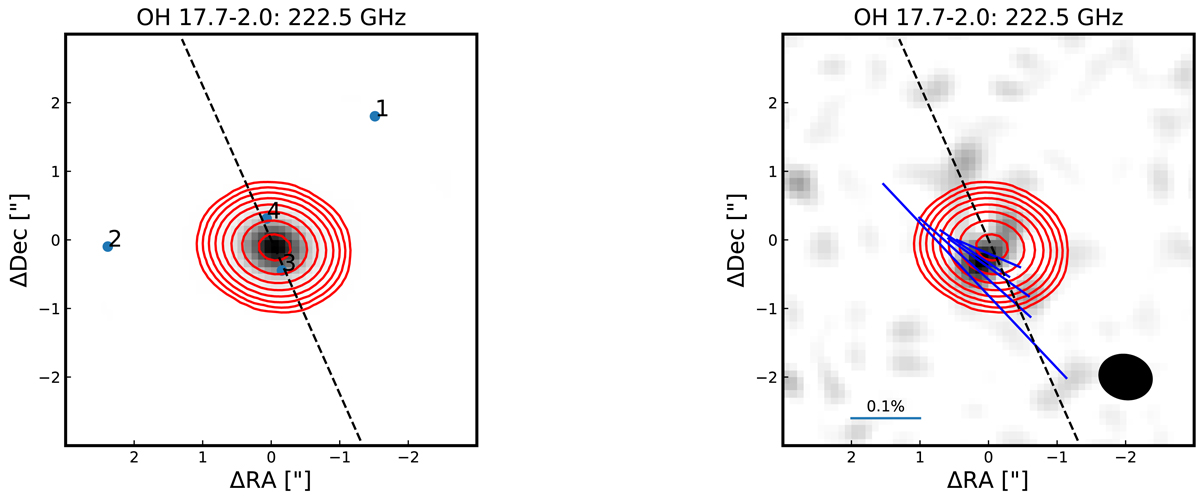
222.5 GHz continuum emission from OH 17.7−2.0 in red contours. The contours are drawn at 0.625, 1.25, 2.5, 5, 10, 20, 40, and 80% of the peak value of 71.8 mJy beam−1. The dashed line indicates the direction of the outflow inferred from mid-infrared continuum and H2 observations (Gledhill et al. 2011). Left: the four labelled solid circles are the sources identified by Gaia within a radius of 2.5″ of OH 17.7−2.0 (see text). The greyscale also represents the continuum emission. Right: the polarised continuum emission (greyscale) of OH 17.7−2.0. The blue line segments indicate the linear polarisation direction where polarised emission is detected at > 3σ, where the rms on the polarised emission σ = 21 μJy beam−1. This means that the uncertainty on the direction is ≲10°. The segments are scaled by the linear polarisation fraction which peaks at Pl, max = 0.47%. The filled ellipse indicates the beam size of the observations.
Current usage metrics show cumulative count of Article Views (full-text article views including HTML views, PDF and ePub downloads, according to the available data) and Abstracts Views on Vision4Press platform.
Data correspond to usage on the plateform after 2015. The current usage metrics is available 48-96 hours after online publication and is updated daily on week days.
Initial download of the metrics may take a while.