Open Access
Fig. D.2
Download original image
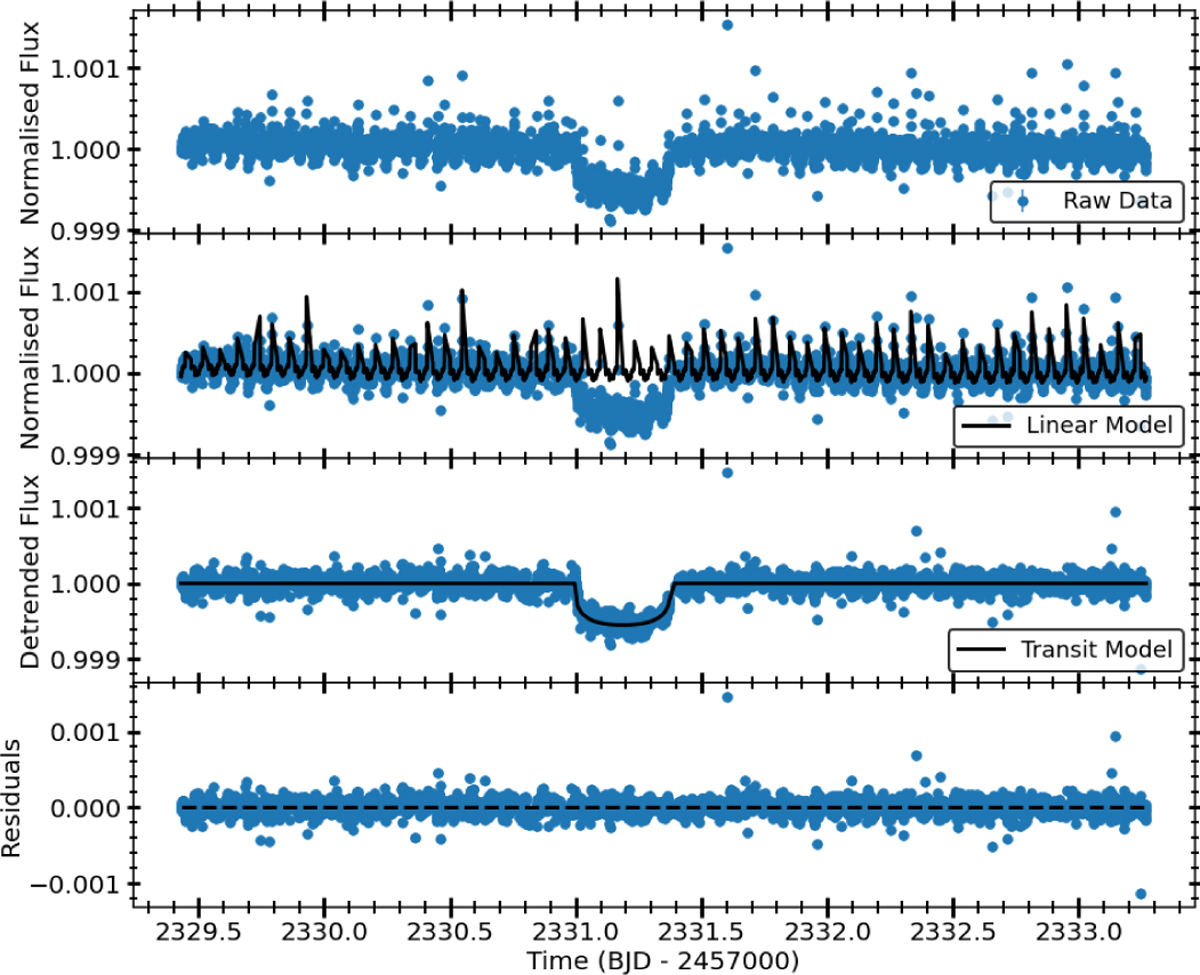
Example result of the fitting method described in Sect. D with one transit (N = 1). Top: DRP fluxes for the visit of v2 Lup d. Middle upper: Linear model of the instrumental vectors and the components of the PSF PCA, Middle lower: N = 1 transit model. Bottom: Residuals to linear model plus N = 1 transit model.
Current usage metrics show cumulative count of Article Views (full-text article views including HTML views, PDF and ePub downloads, according to the available data) and Abstracts Views on Vision4Press platform.
Data correspond to usage on the plateform after 2015. The current usage metrics is available 48-96 hours after online publication and is updated daily on week days.
Initial download of the metrics may take a while.