Fig. D.1
Download original image
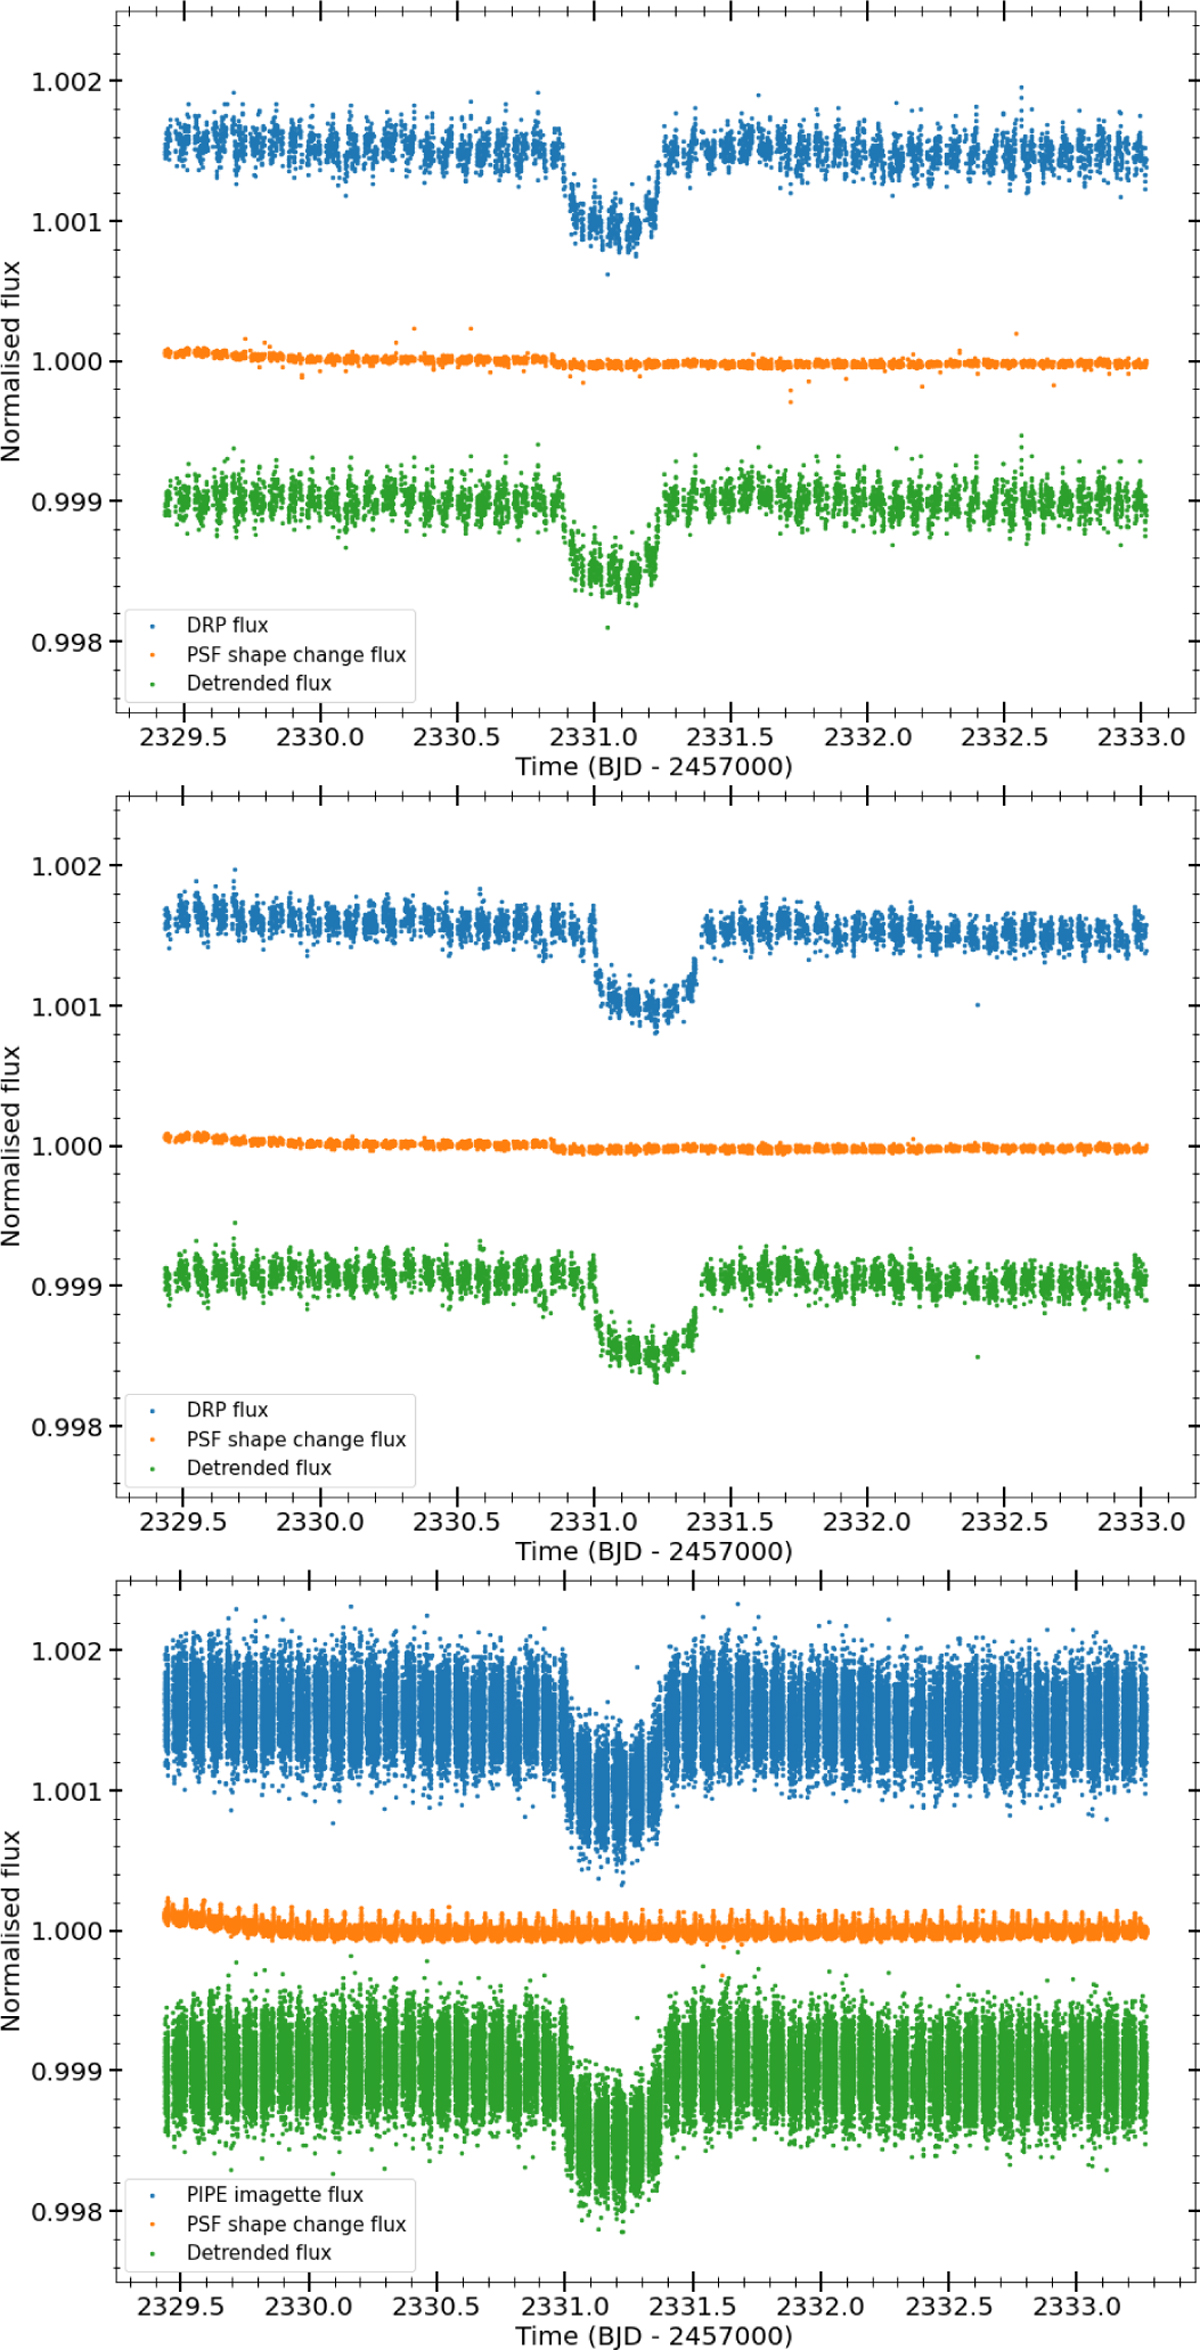
Results of the PSF PCA process. Top: Subarrays and DRP fluxes. Middle: Subarrays and PIPE fluxes. Bottom: Imagettes and PIPE fluxes. Blue represents the raw DRP or PIPE fluxes; orange shows the combined PSF shape-change noise model from the 127, 127, and 210 principal components, respectively; and green shows detrended fluxes. In the TIP analysis, we included all the individual components that comprise the orange curves and the blue raw fluxes.
Current usage metrics show cumulative count of Article Views (full-text article views including HTML views, PDF and ePub downloads, according to the available data) and Abstracts Views on Vision4Press platform.
Data correspond to usage on the plateform after 2015. The current usage metrics is available 48-96 hours after online publication and is updated daily on week days.
Initial download of the metrics may take a while.