Fig. C.1
Download original image
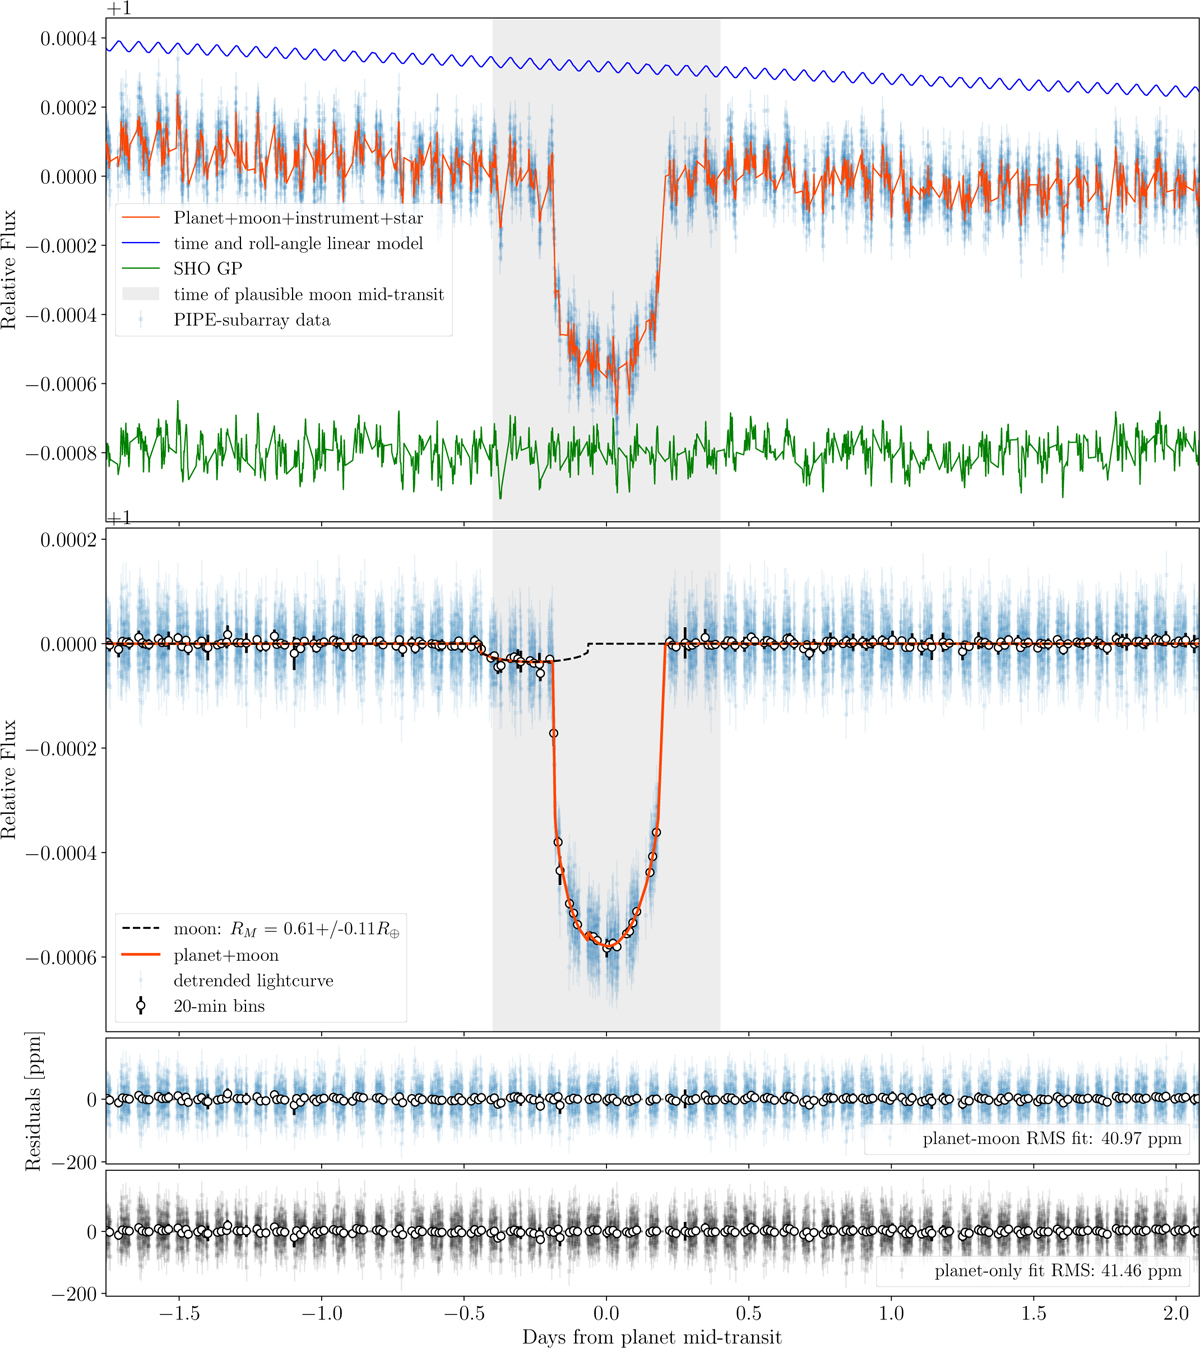
Planet-moon model fit to the CHEOPS light curve of v2 Lup. Top panel: PIPE-subarray light curve (blue points with error bars) modelled with a combination of instrumental effects (blue curve), stellar noise (green curve) and transits of a planet and moon. The model including all these effects is shown in orange. The shaded grey region shows the physically plausible moon mid-transit times within the planet’s Hill sphere. Middle panel: Light curve corrected for the instrumental and stellar noise models (blue points), together with the best-fit planet-moon transit model (orange curve). The dashed black curve shows the isolated moon component. Bottom panels: Residuals from the planet-model fit and planet-only fit. The open black circles show the light curve binned into 20-minute intervals. As described in Sect. C, the shallow transit feature clearly appearing in the second panel from top is an artefact.
Current usage metrics show cumulative count of Article Views (full-text article views including HTML views, PDF and ePub downloads, according to the available data) and Abstracts Views on Vision4Press platform.
Data correspond to usage on the plateform after 2015. The current usage metrics is available 48-96 hours after online publication and is updated daily on week days.
Initial download of the metrics may take a while.