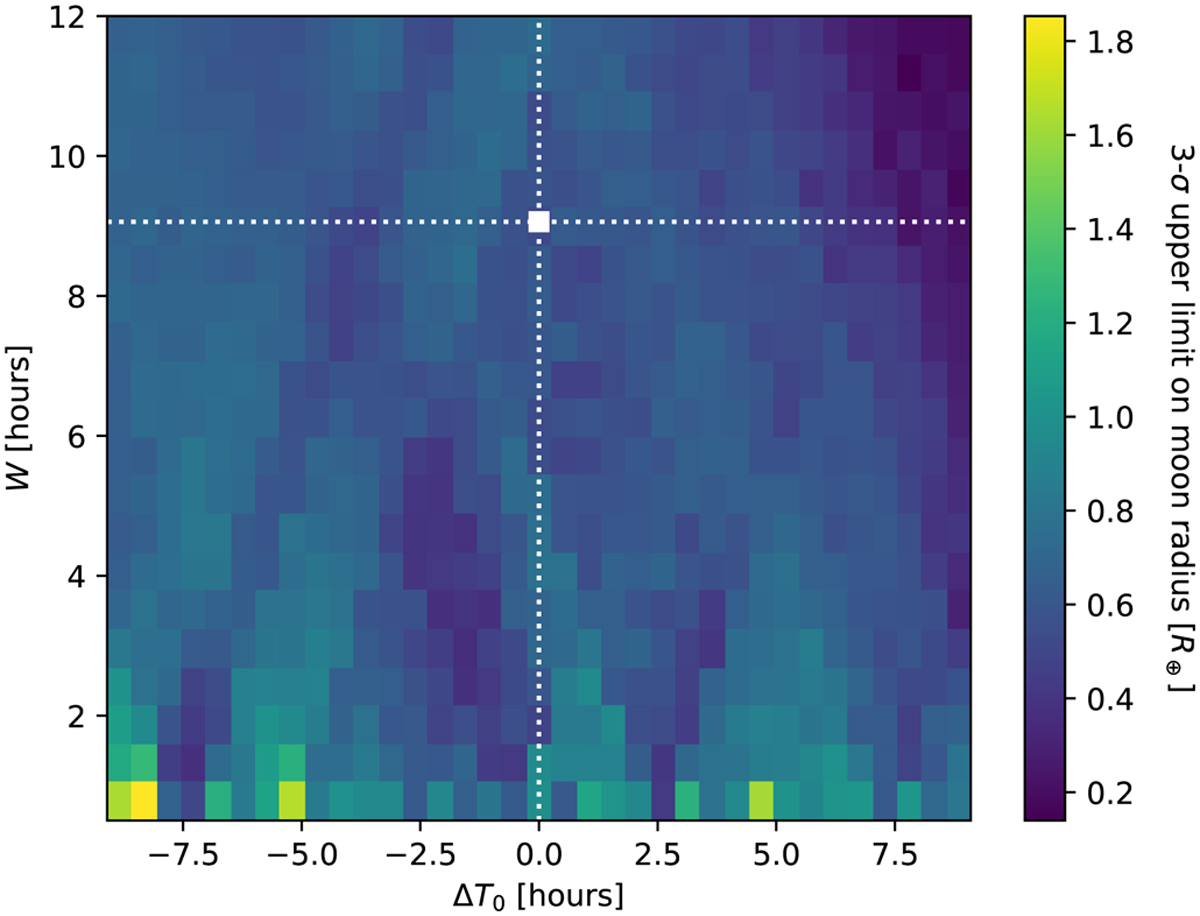
Fig. 5

Download original image
3σ upper limit on the moon radius as a function of the mid-transit time shift ∆T0 with respect to the planet and the transit duration W. The dotted white lines indicate the transit duration and location of planet v2 Lup d. The horizontal axis spans the whole diameter of the Hill sphere (seen in projection on the stellar disc), where ∆T0 < 0 indicates that the moon lags the planet. The bottom lines of the map show short transits that could represent a moon transiting shortly before being hidden by the planet, or transiting close to the limb of the star. Such short transits allow for larger moons to exist while remaining undetectable in our single-epoch data set.
Current usage metrics show cumulative count of Article Views (full-text article views including HTML views, PDF and ePub downloads, according to the available data) and Abstracts Views on Vision4Press platform.
Data correspond to usage on the plateform after 2015. The current usage metrics is available 48-96 hours after online publication and is updated daily on week days.
Initial download of the metrics may take a while.


