Fig. 4
Download original image
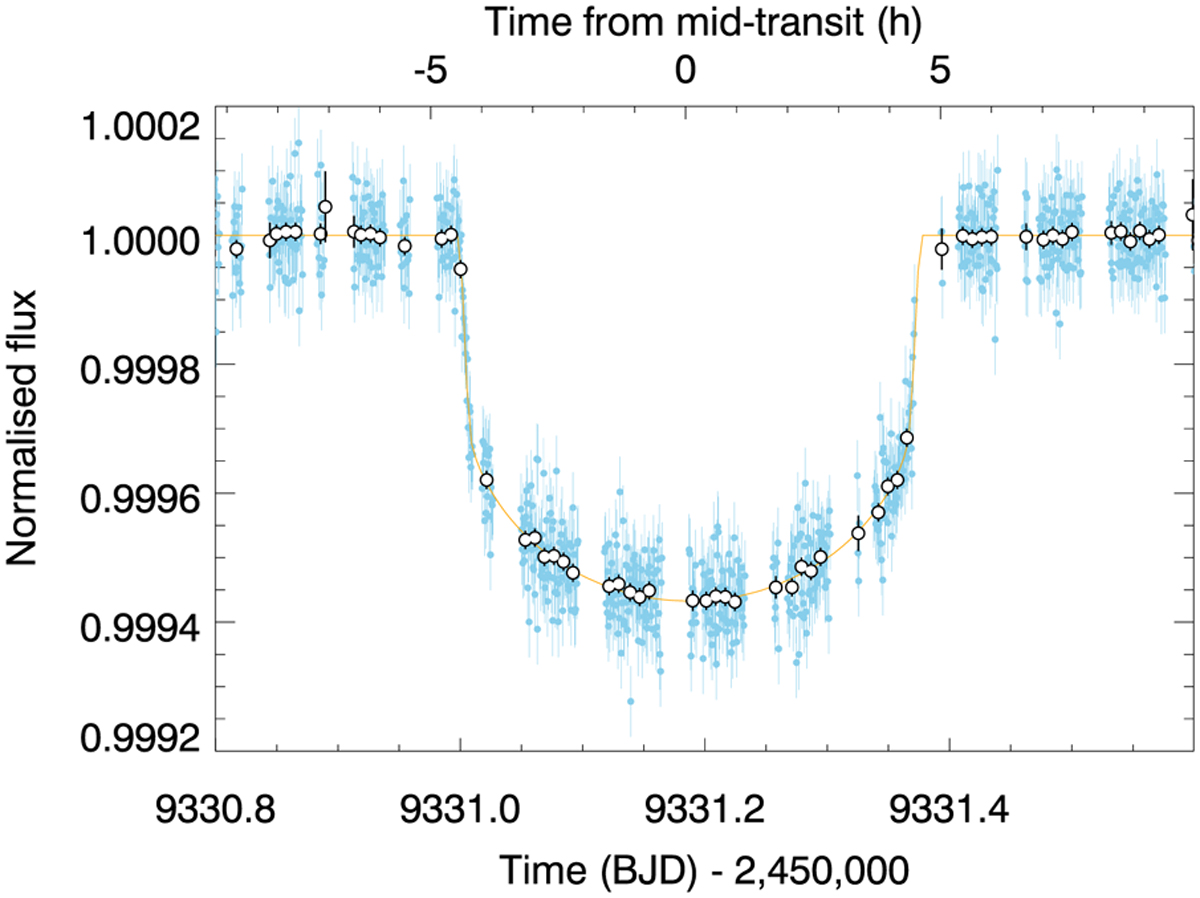
Zoom on the detrended transit of v2 Lup d from the middle panel of Fig. 2. Unbinned exposures are shown as sky blue points with error bars, and white points show a binning by a factor of 15 (or lower depending on how many exposures there are between two light-curve interruptions). The transit model is represented by an orange curve.
Current usage metrics show cumulative count of Article Views (full-text article views including HTML views, PDF and ePub downloads, according to the available data) and Abstracts Views on Vision4Press platform.
Data correspond to usage on the plateform after 2015. The current usage metrics is available 48-96 hours after online publication and is updated daily on week days.
Initial download of the metrics may take a while.