Fig. 3
Download original image
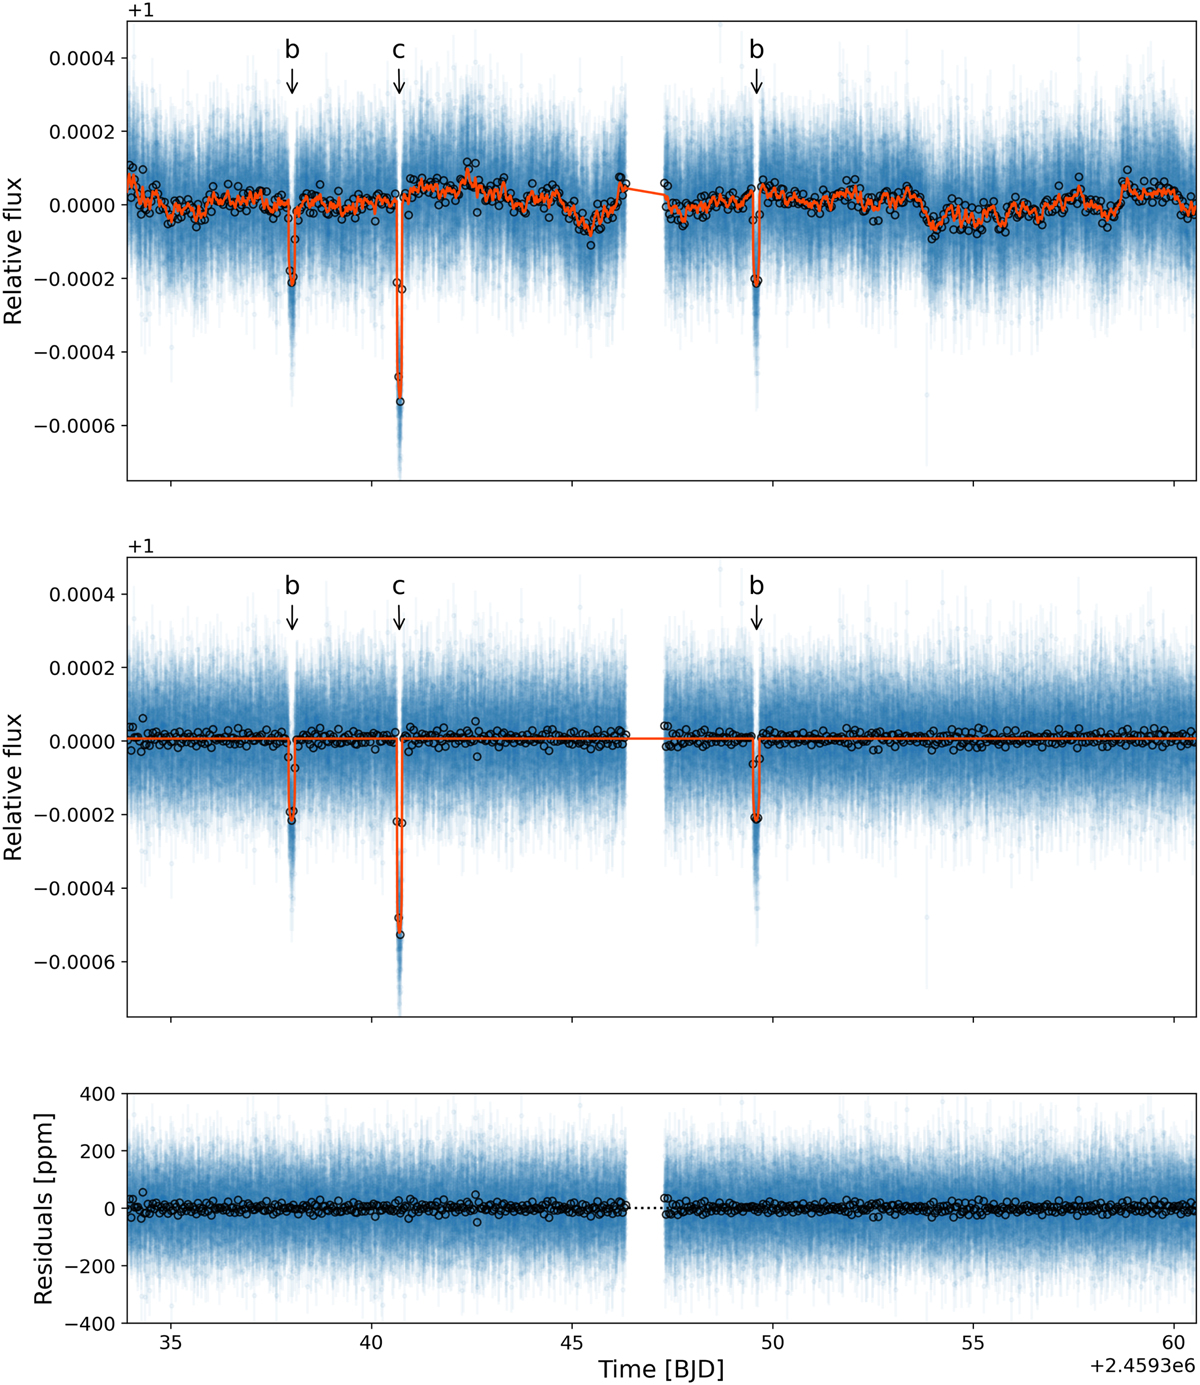
TESS sector 38 light curve of v2 Lup. Top panel: raw light curve obtained by binning the 20-s cadence data into 2-min intervals (blue points with error bars), together with our best-fit model (orange curve), which includes the transits of planets b and c, and the GP model used to account for the correlated noise. Middle panel: light curve obtained after subtracting the GP component of our model, together with our best-fit transit model (orange curve). Bottom panel: residuals resulting from the difference between the detrended light curve and the transit model. For all panels, the error bars of the data points include the fitted additional jitter term added in quadrature. The open black circles show the light curve binned into one-hour intervals.
Current usage metrics show cumulative count of Article Views (full-text article views including HTML views, PDF and ePub downloads, according to the available data) and Abstracts Views on Vision4Press platform.
Data correspond to usage on the plateform after 2015. The current usage metrics is available 48-96 hours after online publication and is updated daily on week days.
Initial download of the metrics may take a while.