Fig. 2
Download original image
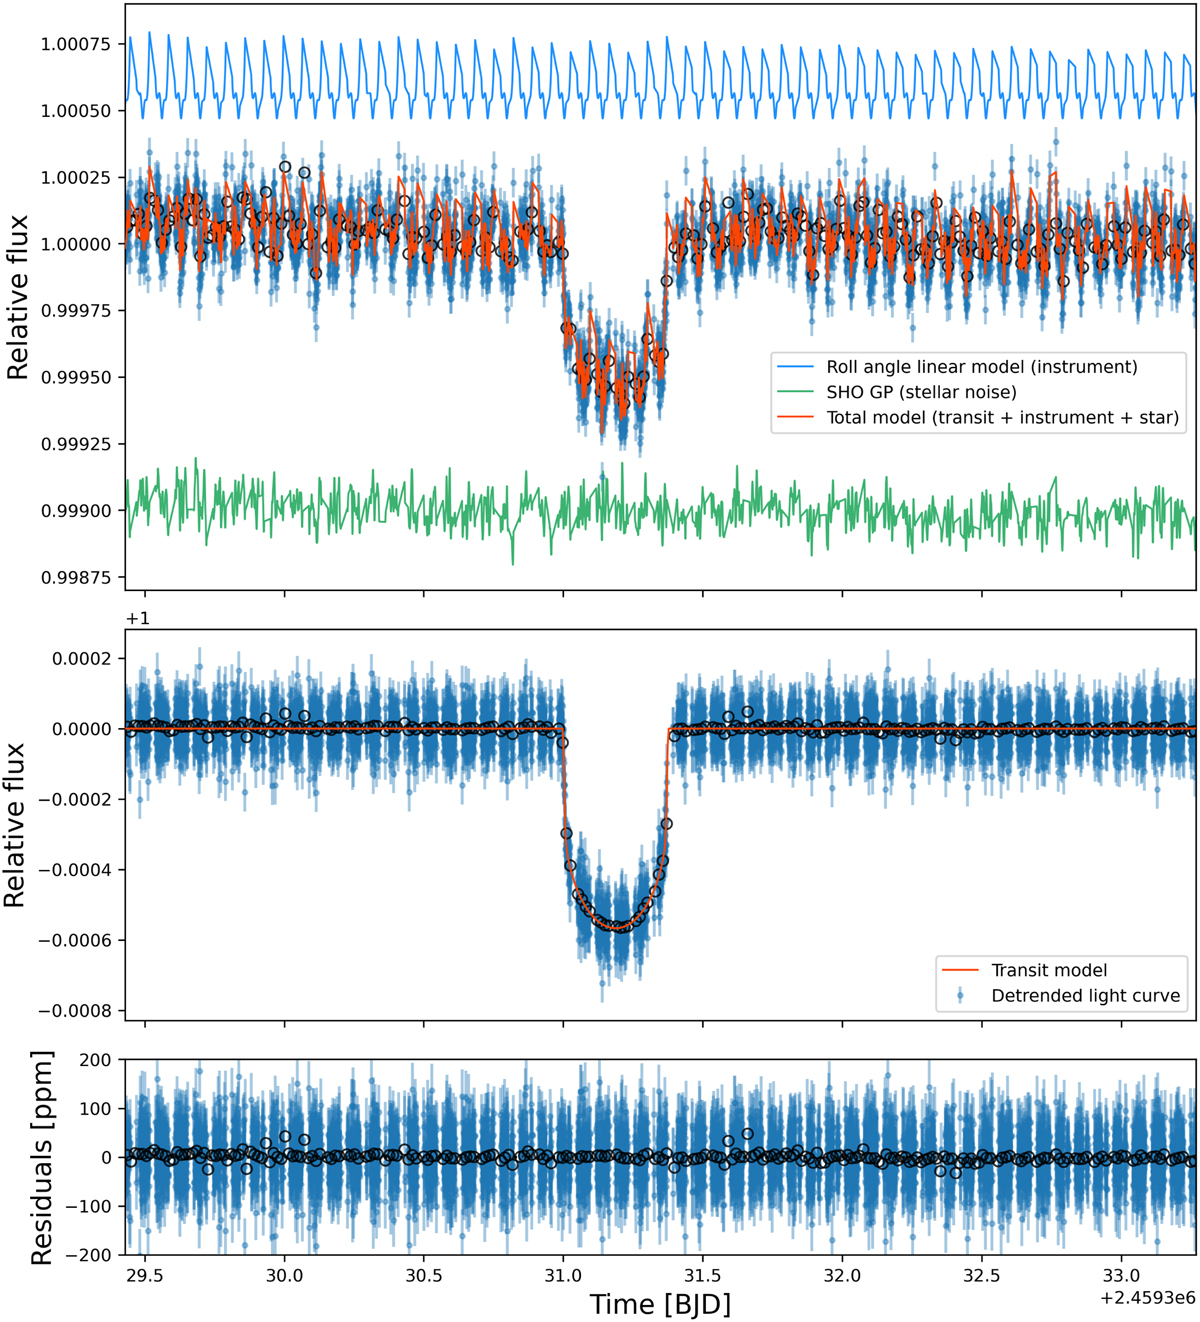
New CHEOPS transit light curve of v2 Lup d. Top panel: the light curve reduced with the CHEOPS automated DRP (blue points with error bars), modelled with a combination of instrumental effects (blue curve), stellar noise (green curve), and a transit. The model including all these effects is shown in orange. Middle panel: light curve corrected for the instrumental and stellar noise models (blue points), together with the best-fit transit model (orange curve). See Fig. 4 for a zoom on the transit itself. Bottom panel: residuals resulting from the difference between the detrended light curve and the transit model. For all panels, the error bars of the data points include the fitted additional jitter term added in quadrature. The open black circles show the light curve binned into 20-min intervals.
Current usage metrics show cumulative count of Article Views (full-text article views including HTML views, PDF and ePub downloads, according to the available data) and Abstracts Views on Vision4Press platform.
Data correspond to usage on the plateform after 2015. The current usage metrics is available 48-96 hours after online publication and is updated daily on week days.
Initial download of the metrics may take a while.